
 Yahoo Finance
 We're Interested To See How Tuas (ASX:TUA) Uses Its Cash Hoard To Grow
Even when a business is losing money, it's possible for shareholders to make money if they buy a good business at the right price. For example, biotech and mining exploration companies often lose money for years before finding success with a new treatment or mineral discovery. But while history lauds those rare successes, those that fail are often forgotten; who remembers Pets.com?
Given this risk, we thought we'd take a look at whether Tuas (ASX:TUA) shareholders should be worried about its cash burn. For the purposes of this article, cash burn is the annual rate at which an unprofitable company spends cash to fund its growth; its negative free cash flow. Let's start with an examination of the business' cash, relative to its cash burn.
View our latest analysis for Tuas
How Long Is Tuas' Cash Runway?
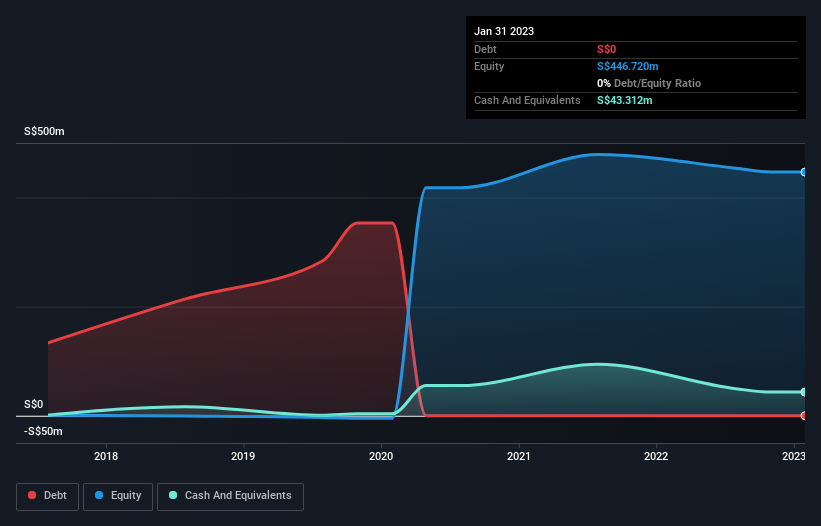
You can calculate a company's cash runway by dividing the amount of cash it has by the rate at which it is spending that cash. As at January 2023, Tuas had cash of S$43m and no debt. Looking at the last year, the company burnt through S$6.3m. That means it had a cash runway of about 6.8 years as of January 2023. Even though this is but one measure of the company's cash burn, the thought of such a long cash runway warms our bellies in a comforting way. Depicted below, you can see how its cash holdings have changed over time.
How Well Is Tuas Growing?
Tuas managed to reduce its cash burn by 82% over the last twelve months, which suggests it's on the right flight path. And revenue is up 24% in that same period; also a good sign. We think it is growing rather well, upon reflection. While the past is always worth studying, it is the future that matters most of all. So you might want to take a peek at how much the company is expected to grow in the next few years.
Can Tuas Raise More Cash Easily?
While Tuas seems to be in a decent position, we reckon it is still worth thinking about how easily it could raise more cash, if that proved desirable. Generally speaking, a listed business can raise new cash through issuing shares or taking on debt. One of the main advantages held by publicly listed companies is that they can sell shares to investors to raise cash and fund growth. By comparing a company's annual cash burn to its total market capitalisation, we can estimate roughly how many shares it would have to issue in order to run the company for another year (at the same burn rate).
Tuas' cash burn of S$6.3m is about 0.8% of its S$781m market capitalisation. That means it could easily issue a few shares to fund more growth, and might well be in a position to borrow cheaply.
Is Tuas' Cash Burn A Worry?
It may already be apparent to you that we're relatively comfortable with the way Tuas is burning through its cash. For example, we think its cash runway suggests that the company is on a good path. Its revenue growth wasn't quite as good, but was still rather encouraging! After considering a range of factors in this article, we're pretty relaxed about its cash burn, since the company seems to be in a good position to continue to fund its growth. Taking an in-depth view of risks, we've identified 2 warning signs for Tuas that you should be aware of before investing.
If you would prefer to check out another company with better fundamentals, then do not miss this free list of interesting companies, that have HIGH return on equity and low debt or this list of stocks which are all forecast to grow.
Have feedback on this article? Concerned about the content? Get in touch with us directly. Alternatively, email editorial-team (at) simplywallst.com.
This article by Simply Wall St is general in nature. We provide commentary based on historical data and analyst forecasts only using an unbiased methodology and our articles are not intended to be financial advice. It does not constitute a recommendation to buy or sell any stock, and does not take account of your objectives, or your financial situation. We aim to bring you long-term focused analysis driven by fundamental data. Note that our analysis may not factor in the latest price-sensitive company announcements or qualitative material. Simply Wall St has no position in any stocks mentioned.
