
 Yahoo Finance
 We're Interested To See How Bannerman Energy (ASX:BMN) Uses Its Cash Hoard To Grow
Just because a business does not make any money, does not mean that the stock will go down. By way of example, Bannerman Energy (ASX:BMN) has seen its share price rise 914% over the last year, delighting many shareholders. But the harsh reality is that very many loss making companies burn through all their cash and go bankrupt.
In light of its strong share price run, we think now is a good time to investigate how risky Bannerman Energy's cash burn is. In this article, we define cash burn as its annual (negative) free cash flow, which is the amount of money a company spends each year to fund its growth. First, we'll determine its cash runway by comparing its cash burn with its cash reserves.
Check out our latest analysis for Bannerman Energy
How Long Is Bannerman Energy's Cash Runway?
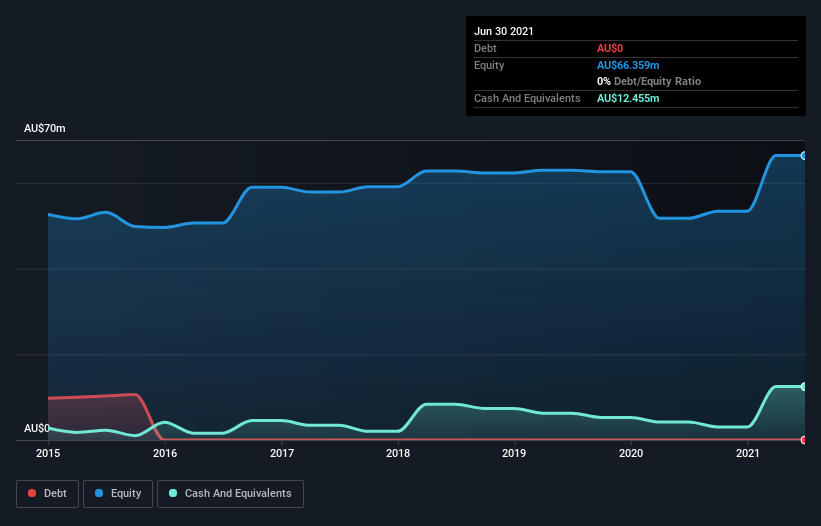
A company's cash runway is calculated by dividing its cash hoard by its cash burn. As at June 2021, Bannerman Energy had cash of AU$12m and no debt. Looking at the last year, the company burnt through AU$2.9m. Therefore, from June 2021 it had 4.3 years of cash runway. There's no doubt that this is a reassuringly long runway. Depicted below, you can see how its cash holdings have changed over time.
How Is Bannerman Energy's Cash Burn Changing Over Time?
Because Bannerman Energy isn't currently generating revenue, we consider it an early-stage business. So while we can't look to sales to understand growth, we can look at how the cash burn is changing to understand how expenditure is trending over time. With the cash burn rate up 38% in the last year, it seems that the company is ratcheting up investment in the business over time. That's not necessarily a bad thing, but investors should be mindful of the fact that will shorten the cash runway. While the past is always worth studying, it is the future that matters most of all. So you might want to take a peek at how much the company is expected to grow in the next few years.
How Easily Can Bannerman Energy Raise Cash?
Given its cash burn trajectory, Bannerman Energy shareholders may wish to consider how easily it could raise more cash, despite its solid cash runway. Issuing new shares, or taking on debt, are the most common ways for a listed company to raise more money for its business. Commonly, a business will sell new shares in itself to raise cash and drive growth. By comparing a company's annual cash burn to its total market capitalisation, we can estimate roughly how many shares it would have to issue in order to run the company for another year (at the same burn rate).
Since it has a market capitalisation of AU$428m, Bannerman Energy's AU$2.9m in cash burn equates to about 0.7% of its market value. So it could almost certainly just borrow a little to fund another year's growth, or else easily raise the cash by issuing a few shares.
How Risky Is Bannerman Energy's Cash Burn Situation?
As you can probably tell by now, we're not too worried about Bannerman Energy's cash burn. In particular, we think its cash runway stands out as evidence that the company is well on top of its spending. Although its increasing cash burn does give us reason for pause, the other metrics we discussed in this article form a positive picture overall. Looking at all the measures in this article, together, we're not worried about its rate of cash burn; the company seems well on top of its medium-term spending needs. On another note, Bannerman Energy has 6 warning signs (and 2 which shouldn't be ignored) we think you should know about.
Of course, you might find a fantastic investment by looking elsewhere. So take a peek at this free list of companies insiders are buying, and this list of stocks growth stocks (according to analyst forecasts)
This article by Simply Wall St is general in nature. We provide commentary based on historical data and analyst forecasts only using an unbiased methodology and our articles are not intended to be financial advice. It does not constitute a recommendation to buy or sell any stock, and does not take account of your objectives, or your financial situation. We aim to bring you long-term focused analysis driven by fundamental data. Note that our analysis may not factor in the latest price-sensitive company announcements or qualitative material. Simply Wall St has no position in any stocks mentioned.
Have feedback on this article? Concerned about the content? Get in touch with us directly. Alternatively, email editorial-team (at) simplywallst.com.
