
 Yahoo Finance
 We're Hopeful That Buru Energy (ASX:BRU) Will Use Its Cash Wisely
We can readily understand why investors are attracted to unprofitable companies. For example, although software-as-a-service business Salesforce.com lost money for years while it grew recurring revenue, if you held shares since 2005, you'd have done very well indeed. But the harsh reality is that very many loss making companies burn through all their cash and go bankrupt.
So, the natural question for Buru Energy (ASX:BRU) shareholders is whether they should be concerned by its rate of cash burn. In this article, we define cash burn as its annual (negative) free cash flow, which is the amount of money a company spends each year to fund its growth. The first step is to compare its cash burn with its cash reserves, to give us its 'cash runway'.
View our latest analysis for Buru Energy
How Long Is Buru Energy's Cash Runway?
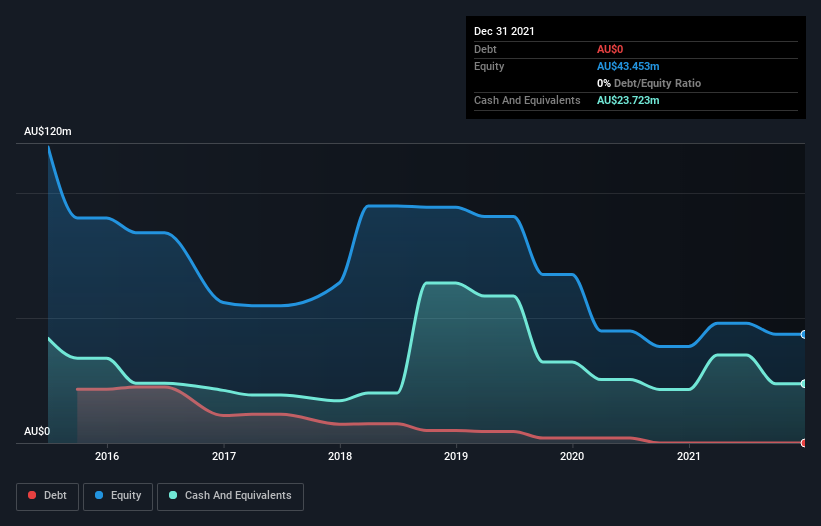
A cash runway is defined as the length of time it would take a company to run out of money if it kept spending at its current rate of cash burn. When Buru Energy last reported its balance sheet in December 2021, it had zero debt and cash worth AU$24m. Looking at the last year, the company burnt through AU$12m. That means it had a cash runway of about 2.0 years as of December 2021. Arguably, that's a prudent and sensible length of runway to have. The image below shows how its cash balance has been changing over the last few years.
How Well Is Buru Energy Growing?
Some investors might find it troubling that Buru Energy is actually increasing its cash burn, which is up 48% in the last year. And we must say we find it concerning that operating revenue dropped 15% over the same period. Taken together, we think these growth metrics are a little worrying. Of course, we've only taken a quick look at the stock's growth metrics, here. This graph of historic earnings and revenue shows how Buru Energy is building its business over time.
How Easily Can Buru Energy Raise Cash?
While Buru Energy seems to be in a fairly good position, it's still worth considering how easily it could raise more cash, even just to fuel faster growth. Generally speaking, a listed business can raise new cash through issuing shares or taking on debt. One of the main advantages held by publicly listed companies is that they can sell shares to investors to raise cash and fund growth. We can compare a company's cash burn to its market capitalisation to get a sense for how many new shares a company would have to issue to fund one year's operations.
Buru Energy's cash burn of AU$12m is about 10% of its AU$113m market capitalisation. As a result, we'd venture that the company could raise more cash for growth without much trouble, albeit at the cost of some dilution.
Is Buru Energy's Cash Burn A Worry?
On this analysis of Buru Energy's cash burn, we think its cash runway was reassuring, while its increasing cash burn has us a bit worried. While we're the kind of investors who are always a bit concerned about the risks involved with cash burning companies, the metrics we have discussed in this article leave us relatively comfortable about Buru Energy's situation. On another note, we conducted an in-depth investigation of the company, and identified 3 warning signs for Buru Energy (1 is a bit unpleasant!) that you should be aware of before investing here.
Of course, you might find a fantastic investment by looking elsewhere. So take a peek at this free list of companies insiders are buying, and this list of stocks growth stocks (according to analyst forecasts)
Have feedback on this article? Concerned about the content? Get in touch with us directly. Alternatively, email editorial-team (at) simplywallst.com.
This article by Simply Wall St is general in nature. We provide commentary based on historical data and analyst forecasts only using an unbiased methodology and our articles are not intended to be financial advice. It does not constitute a recommendation to buy or sell any stock, and does not take account of your objectives, or your financial situation. We aim to bring you long-term focused analysis driven by fundamental data. Note that our analysis may not factor in the latest price-sensitive company announcements or qualitative material. Simply Wall St has no position in any stocks mentioned.
