
 Yahoo Finance
 We're Hopeful That Anghami (NASDAQ:ANGH) Will Use Its Cash Wisely
Just because a business does not make any money, does not mean that the stock will go down. For example, biotech and mining exploration companies often lose money for years before finding success with a new treatment or mineral discovery. But while history lauds those rare successes, those that fail are often forgotten; who remembers Pets.com?
So should Anghami (NASDAQ:ANGH) shareholders be worried about its cash burn? For the purpose of this article, we'll define cash burn as the amount of cash the company is spending each year to fund its growth (also called its negative free cash flow). We'll start by comparing its cash burn with its cash reserves in order to calculate its cash runway.
See our latest analysis for Anghami
How Long Is Anghami's Cash Runway?
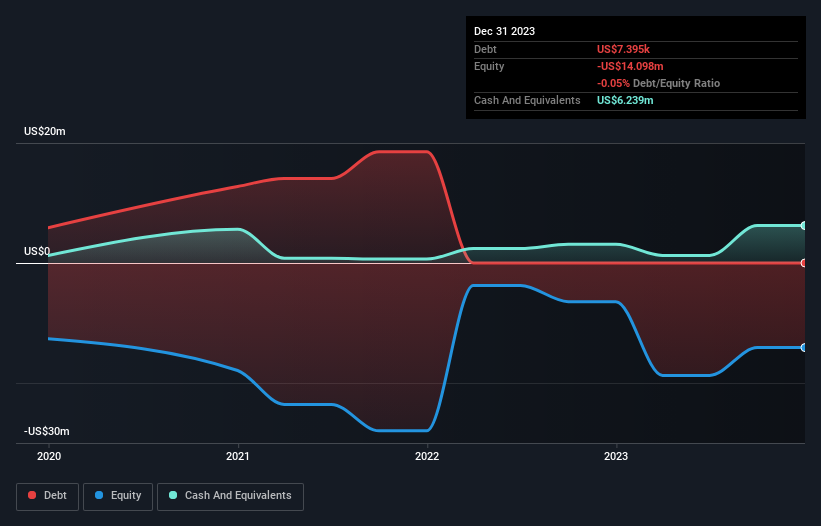
A company's cash runway is the amount of time it would take to burn through its cash reserves at its current cash burn rate. Anghami has such a small amount of debt that we'll set it aside, and focus on the US$6.2m in cash it held at December 2023. Importantly, its cash burn was US$5.1m over the trailing twelve months. So it had a cash runway of approximately 15 months from December 2023. While that cash runway isn't too concerning, sensible holders would be peering into the distance, and considering what happens if the company runs out of cash. You can see how its cash balance has changed over time in the image below.
How Well Is Anghami Growing?
We reckon the fact that Anghami managed to shrink its cash burn by 54% over the last year is rather encouraging. But the revenue dip of 15% in the same period was a bit concerning. On balance, we'd say the company is improving over time. Of course, we've only taken a quick look at the stock's growth metrics, here. This graph of historic earnings and revenue shows how Anghami is building its business over time.
How Easily Can Anghami Raise Cash?
Anghami seems to be in a fairly good position, in terms of cash burn, but we still think it's worthwhile considering how easily it could raise more money if it wanted to. Generally speaking, a listed business can raise new cash through issuing shares or taking on debt. Many companies end up issuing new shares to fund future growth. By comparing a company's annual cash burn to its total market capitalisation, we can estimate roughly how many shares it would have to issue in order to run the company for another year (at the same burn rate).
Anghami's cash burn of US$5.1m is about 7.0% of its US$73m market capitalisation. That's a low proportion, so we figure the company would be able to raise more cash to fund growth, with a little dilution, or even to simply borrow some money.
So, Should We Worry About Anghami's Cash Burn?
On this analysis of Anghami's cash burn, we think its cash burn relative to its market cap was reassuring, while its falling revenue has us a bit worried. Cash burning companies are always on the riskier side of things, but after considering all of the factors discussed in this short piece, we're not too worried about its rate of cash burn. On another note, Anghami has 6 warning signs (and 5 which make us uncomfortable) we think you should know about.
Of course Anghami may not be the best stock to buy. So you may wish to see this free collection of companies boasting high return on equity, or this list of stocks that insiders are buying.
Have feedback on this article? Concerned about the content? Get in touch with us directly. Alternatively, email editorial-team (at) simplywallst.com.
This article by Simply Wall St is general in nature. We provide commentary based on historical data and analyst forecasts only using an unbiased methodology and our articles are not intended to be financial advice. It does not constitute a recommendation to buy or sell any stock, and does not take account of your objectives, or your financial situation. We aim to bring you long-term focused analysis driven by fundamental data. Note that our analysis may not factor in the latest price-sensitive company announcements or qualitative material. Simply Wall St has no position in any stocks mentioned.
