
 Yahoo Finance
 Wells Fargo's (WFC) Q4 Earnings Lag Estimates, Costs Up
Wells Fargo’s WFC fourth-quarter 2019 adjusted earnings of 93 cents per share lagged the Zacks Consensus Estimate of $1.12, on lower net interest income and rise in expenses. Results exclude litigation accruals.
Including litigation accruals (not tax-deductible) worth 33 cents per share related to certain matters, earnings came in at 60 cents per share compared with the prior-year quarter’s $1.21.
Reduced net interest income on lower rates and rise in expenses negatively impacted the results. Moreover, provisions soared. However, higher fee income, driven by improved mortgage banking business, was on the upside. Further, escalation in loans and deposits acted as tailwinds.
For the year ended 2019, earnings per share came in at $4.05, down 23 cents, year on year. The reported figure also missed the Zacks Consensus Estimate of $4.53.
Including litigation accruals, net income came in at $2.9 billion in the fourth quarter compared with the $6.1 billion recorded in the prior-year quarter. For 2019, net income was $19.6 billion compared with the $22.4 billion reported in the prior year.
The quarter’s total revenues came in at $19.9 billion, outpacing the Zacks Consensus Estimate of $19.8 billion. The revenue figure, however, came in lower than the prior-year quarter’s tally of $21 billion.
Revenues for the year ended 2019 came in at $85.1 billion, beating the Zacks Consensus Estimate of $84.3 billion. However, revenues edged down 1.5%, year over year.
Furthermore, on a year-over-year basis, quarterly revenue generation at the business segments was mixed. The Community Banking segment’s total quarterly revenues slipped 8.7% and Wholesale Banking revenues were down around 4.3%. Yet, revenues in the Wealth and Investment Management unit were up 2.5%.
Net Interest Income Falls, Costs Up, Fee Income Improves
Wells Fargo’s net interest income in the fourth quarter came in at $11.2 billion, down 11% year over year. Higher interest expense, lower other interest income and reduced interest income from loans held for sale, loans and debt securities resulted in this downside. This was partly offset by increased interest income from equity securities and mortgage loans held for sale. Further, net interest margin shrunk 31 basis points (bps) year over year to 2.53%.
Non-interest income at Wells Fargo came in at around $8.7 billion, up 4% year over year, primarily owing to rise in service charges on deposit accounts, card fees and mortgage banking revenues. These increases were mainly muted by lower revenues from insurance, lease income, other fees and income.
As of Dec 31, 2019, total loans were $962.3 billion, up 1% sequentially. Higher consumer as well as commercial loan portfolio was recorded. Total deposits came in at $1.32 trillion, up 1% from the prior quarter.
Non-interest expense at Wells Fargo was around $15.6 billion in the October-December quarter, up 17% from the year-earlier quarter. This uptick primarily resulted from elevated salaries and commission and incentive compensation, employee benefits, equipment costs and other expenses. These were partly offset by lower core deposit and other intangibles, along with FDIC and other deposit assessments.
The company’s efficiency ratio of 78.6% came in above the 63.6% recorded in the year-ago quarter. A rise in efficiency ratio indicates a fall in profitability.
Credit Quality: A Mixed Bag
Wells Fargo’s credit quality metrics was a mixed bag in the December-end quarter. Allowance for credit losses, including the allowance for unfunded commitments, totaled $10.5 billion as of Dec 31, 2019, down 1.9% year over year.
Net charge-offs were $769 million or 0.32% of average loans in the reported quarter, up 6.7% from the year-ago quarter’s net charge-offs of $721 million (0.30%). Non-performing assets slipped 18.8% to $5.6 billion in the fourth quarter, from the $6.9 billion reported in the prior-year quarter. Notably, provision for credit losses was $644 million, 24% higher.
Strong Capital Position
Wells Fargo has maintained a sturdy capital position. During the October-December period, the company returned $9 billion to shareholders through common stock dividends and net share repurchases.
Wells Fargo’s Tier 1 common equity under Basel III (fully phased-in) decreased to $138.8 billion from the $146.4 billion witnessed in the prior-year quarter. The Tier 1 common equity to total risk-weighted assets ratio was estimated at 11.1% under Basel III (fully phased-in) as of Dec 31, 2019, down from 11.7% in the year-earlier quarter.
Book value per share advanced to $40.31 from the $38.06 recorded in the comparable period last year.
Return on assets was 0.59%, down from the prior-year quarter’s 1.28%. Return on equity was 5.91%, down from the year-ago quarter’s 12.89%.
Our Viewpoint
Despite several legal tensions, Wells Fargo remains focused on maintaining its financial position. In addition, the company is working on strategic initiatives, which might help regain the confidence of its clients and shareholders.
Nevertheless, top-line headwinds, along with lower net interest income woes, are expected to prevail. Though improving fee income is a tailwind, thanks to the revival in mortgage banking business, flaring up provisions and expenses is another drag.
Wells Fargo & Company Price, Consensus and EPS Surprise
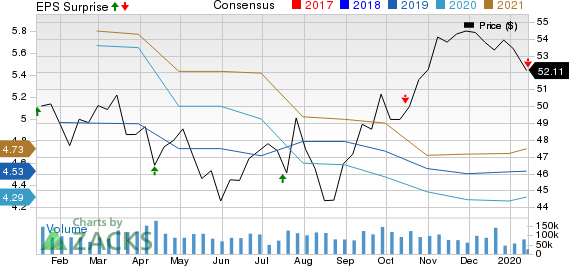
Wells Fargo & Company price-consensus-eps-surprise-chart | Wells Fargo & Company Quote
Currently, Wells Fargo carries a Zacks Rank #3 (Hold). You can see the complete list of today’s Zacks #1 Rank (Strong Buy) stocks here.
Among other major banks, Goldman Sachs GS, U.S. Bancorp USB and Bank of America BAC will report their quarterly figures on Jan 15.
Breakout Biotech Stocks with Triple-Digit Profit Potential
The biotech sector is projected to surge beyond $775 billion by 2024 as scientists develop treatments for thousands of diseases. They’re also finding ways to edit the human genome to literally erase our vulnerability to these diseases.
Zacks has just released Century of Biology: 7 Biotech Stocks to Buy Right Now to help investors profit from 7 stocks poised for outperformance. Our recent biotech recommendations have produced gains of +50%, +83% and +164% in as little as 2 months. The stocks in this report could perform even better.
See these 7 breakthrough stocks now>>
Want the latest recommendations from Zacks Investment Research? Today, you can download 7 Best Stocks for the Next 30 Days. Click to get this free report
Wells Fargo & Company (WFC) : Free Stock Analysis Report
Bank of America Corporation (BAC) : Free Stock Analysis Report
U.S. Bancorp (USB) : Free Stock Analysis Report
The Goldman Sachs Group, Inc. (GS) : Free Stock Analysis Report
To read this article on Zacks.com click here.
Zacks Investment Research
