
 Yahoo Finance
 Wells Fargo's (WFC) Q3 Earnings Disappoint on Lower NII
Wells Fargo’s WFC third-quarter 2019 earnings of 92 cents per share lagged the Zacks Consensus Estimate of $1.15 on lower net interest income. The figure also comes in lower than the prior-year quarter earnings of $1.13 per share.
Results include discrete litigation accrual (not tax-deductible) worth 35 cents per share, and gain from the sale of Institutional Retirement and Trust (IRT) business worth 20 cents. Also, the partial redemption of Series K Preferred Stock decreased earnings by 5 cents.
Higher fee income driven by improved trading activities, partly offset by lower mortgage banking revenues, aided the company’s performance. Further, escalation in loans and deposits acted as tailwinds. However, reduced net interest income and rise in expenses were undermining factors. Moreover, provisions soared.
Net income came in at $4.6 billion compared with the $6 billion recorded in the prior-year quarter.
The quarter’s total revenues came in at $22 billion, outpacing the Zacks Consensus Estimate of $21.1 billion. The reported figure also comes in higher than the prior-year quarter’s tally of $21.9 billion.
Furthermore, on a year-over-year basis, quarterly revenue generation at the business segments was mixed. The Community Banking segment’s total quarterly revenues slipped 5.1% and Wholesale Banking revenues were down around 5.5%. Yet, revenues in the Wealth and Investment Management unit were up 21.4%.
Net Interest Income Falls, Costs Up, Fee Income Improves
Wells Fargo’s net interest income in the quarter came in at $11.6 billion, down 8% year over year. Higher interest expense and lower interest income from loans held for sale, equity securities and loans led to this downside, partly offset by increased interest income from debt securities, mortgage loans held for sale along with higher other interest income. Furthermore, net interest margin shrunk 28 basis points (bps) year over year to 2.66%.
Non-interest income at Wells Fargo came in at around $10.4 billion, up 11% year over year, primarily owing to rise in service charges on deposit accounts, card fees, net gains from trading activities and equity securities along with elevated other income. These increases were mainly muted by lower mortgage banking revenues and reduced net gains on debt securities.
As of Sep 30, 2019, total loans were $954.9 billion, slightly up sequentially. Higher consumer as well as commercial loan portfolio was recorded. Total deposits came in at $1.31 trillion, up 2% from the prior quarter.
Non-interest expense at Wells Fargo was around $15.2 billion, up 10% from the year-earlier quarter. This rise in expenses primarily resulted from elevated salaries and commission and incentive compensation, equipment costs and other expenses. These were partly offset by lower employee benefits, core deposit and other intangibles, along with FDIC and other deposit assessments.
The company’s efficiency ratio of 69.1% came in above the 62% recorded in the year-ago quarter. A rise in efficiency ratio indicates a fall in profitability.
Credit Quality: A Mixed Bag
Wells Fargo’s credit quality metrics was a mixed bag in the September-end quarter. Allowance for credit losses, including the allowance for unfunded commitments, totaled $10.6 billion as of Sep 30, 2019, down 3.6% year over year.
Net charge-offs were $645 million or 0.27% of average loans in the reported quarter, down 5.1% from the year-ago quarter’s net charge-offs of $680 million (0.29%). Non-performing assets slipped 16.7% to $6 billion, in the third quarter, from $7.2 billion reported in the prior-year quarter. Notably, provision for credit losses was $695 million, 20% higher.
Strong Capital Position
Wells Fargo has maintained a sturdy capital position. During the July-September quarter, the company returned $9 billion to shareholders through common stock dividends and net share repurchases.
Wells Fargo’s Tier 1 common equity under Basel III (fully phased-in) decreased to $144.7 billion from $148.9 billion recorded in the prior-year quarter. The Tier 1 common equity to total risk-weighted assets ratio was estimated at 11.6% under Basel III (fully phased-in) as of Sep 30, 2019, down from 11.9% in the year-earlier quarter.
Book value per share advanced to $40.48 from $37.55 recorded in the comparable period last year.
Return on assets was 0.95%, down from 1.27% in the prior-year quarter. Return on equity was 9%, down from 12.04% in the comparable prior-year quarter.
Our Viewpoint
Despite several legal tensions, Wells Fargo remains focused on maintaining its financial position. This banking giant is on track with its cost-cutting targets. In addition, the company is working on strategic initiatives, which might help regain the confidence of its clients and shareholders.
Nevertheless, top-line headwinds, along with lower net interest income woes, are expected to prevail. Though improving fee income is a tailwind, flaring up provisions and expenses is another drag, along with slowdown in the mortgage business.
Wells Fargo & Company Price, Consensus and EPS Surprise
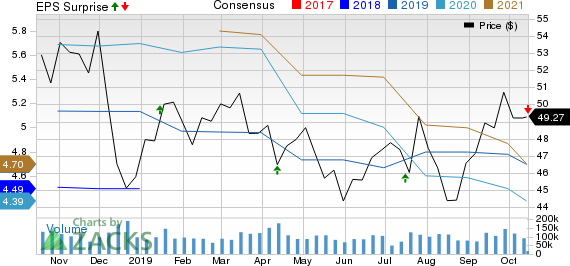
Wells Fargo & Company price-consensus-eps-surprise-chart | Wells Fargo & Company Quote
Currently, Wells Fargo carries a Zacks Rank #5 (Strong Sell).
You can see the complete list of today’s Zacks #1 Rank (Strong Buy) stocks here.
Among other mega banks, Bank of America Corporation BAC and U.S. Bancorp USB are scheduled to report their quarterly numbers on Oct 16, while Morgan Stanley MS will report on Oct 17.
Today's Best Stocks from Zacks
Would you like to see the updated picks from our best market-beating strategies? From 2017 through 2018, while the S&P 500 gained +15.8%, five of our screens returned +38.0%, +61.3%, +61.6%, +68.1%, and +98.3%.
This outperformance has not just been a recent phenomenon. From 2000 – 2018, while the S&P averaged +4.8% per year, our top strategies averaged up to +56.2% per year.
See their latest picks free >>
Want the latest recommendations from Zacks Investment Research? Today, you can download 7 Best Stocks for the Next 30 Days. Click to get this free report
Bank of America Corporation (BAC) : Free Stock Analysis Report
U.S. Bancorp (USB) : Free Stock Analysis Report
Wells Fargo & Company (WFC) : Free Stock Analysis Report
Morgan Stanley (MS) : Free Stock Analysis Report
To read this article on Zacks.com click here.
