
 Yahoo Finance
 Weaker American Inflation Drives the Dollar Down
The decline in inflation in June announced on 11 July was the third successive month of the rate falling and might suggest an ongoing downward trend. All four main releases – core and non-core annual and monthly – were lower than the consensus, with the reaction by the dollar so far being strongly negative in most cases. This article summarises the context of the latest data on inflation and what they might mean for the policy of the Federal Reserve (‘the Fed’) later this year then looks briefly at the charts of USDJPY and GBPJPY.
Annual headline inflation in the USA has now declined to its lowest in a year:
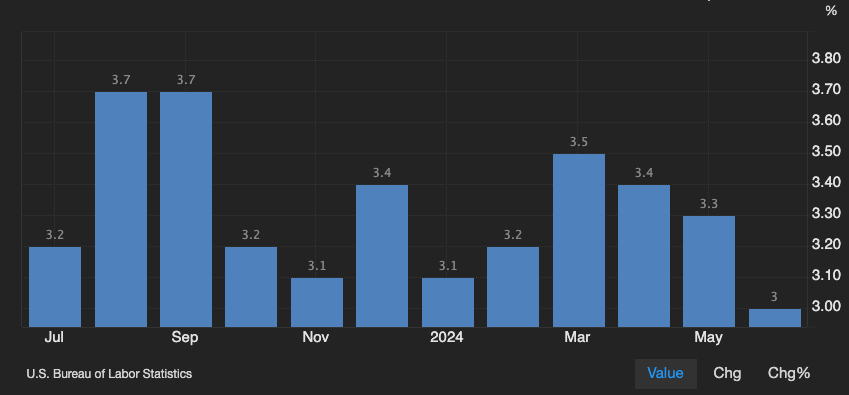
This was also the first time monthly CPI declined in more than four years. The lower readings from annual figures were due primarily to declining costs of energy, but shelter, vehicles and transport also contributed. However, food inflation increased very slightly.
The Fed has repeatedly stated that it needs to see evidence of inflation declining sustainably towards the target of 2% before it embarks on a cycle of loosening policy. It’s questionable whether they’ve found that yet: in early 2023 the downward trend for inflation ended and the headline figure stuck at or above 3%.
According to CME FedWatch Tool, the probability of at least one cut by the Fed’s meeting on 18 September is now around 89%, indicating near certainty among participants. The likelihood of at least two cuts by the last meeting of the year in December is very similar at around 88%. Neither of these are a huge change from last week or last month but confidence in this scenario has increased since the latest release of inflation.
There are still two more releases of the consumer price index before the Fed’s meeting on 18 September. If these are higher than expected, which doesn’t seem extremely unlikely, the probabilities for monetary loosening would change. Traders will continue to monitor job data and GDP in the next few weeks as well, while coverage of the presidential race will remain omnipresent.
Dollar-yen, Daily
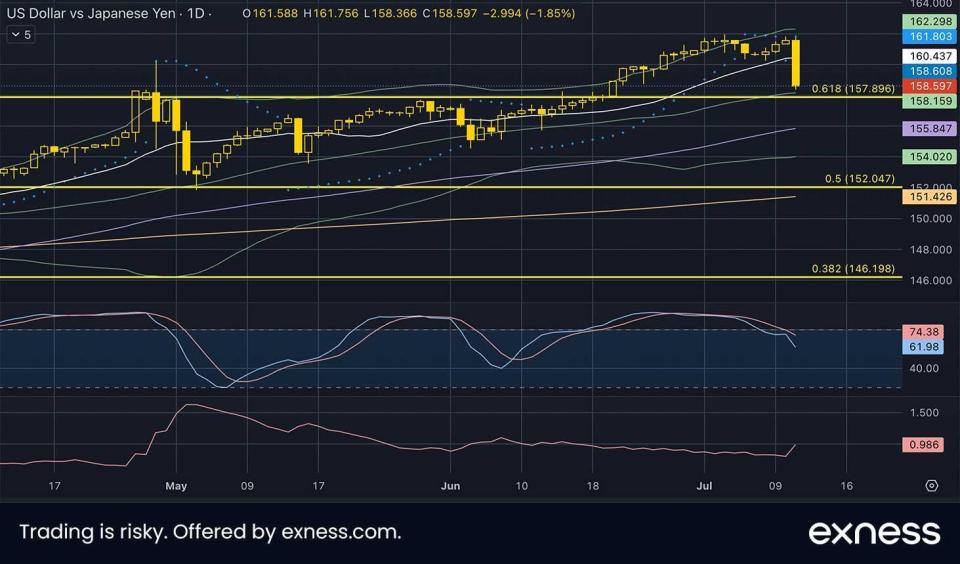
The dollar’s losses against the yen come as a result of lower American inflation and increasing expectations that the Bank of Japan (‘the BoJ’) might start to be more aggressive in normalising policy and generally trying to support the yen. The performance of the Japanese economy in recent years based on GDP has been weak and the extended divergence in policy between the BoJ and all other major central banks has fuelled the carry trade and weakened sentiment on the yen.
¥158.30 is an important area: this was the closing high in late April and is only slightly above the 61.8% weekly Fibonacci extension. A move clearly below there is questionable unless there’s an intervention by the BoJ or Japanese government or if participants become more certain that the former will hike again on 31 July. A retest of recent highs around ¥162 before the trend retraces significantly or even possibly reverses might be more likely.
There’s no longer any overbought signal on the daily chart and ATR has risen after the drop on 11 July. This kind of shakeout can attract new joiners to a strong trend because it offers a seemingly clear opportunity to enter at a better price. The situation here is complicated though by the possibility of an intervention at any time making the current technical picture redundant.
Cable, Daily
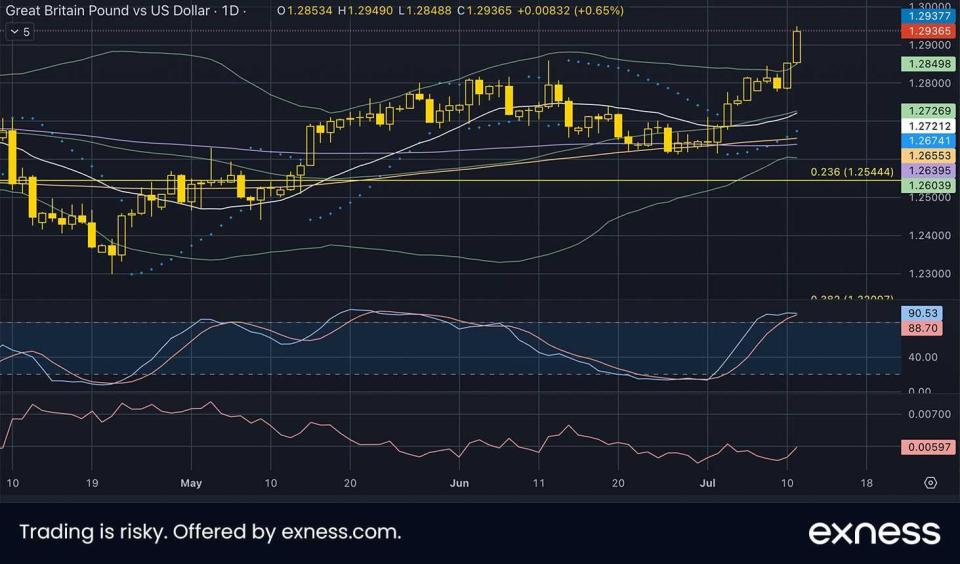
GBPUSD has had various boosts recently from a range of positive factors apart from lower American inflation. These include positivity around the new British government and better than expected British GDP. Overall expectations seem to be that the Bank of England will cut rates at its meeting on 1 August.
11 July’s intraday high around $1.295 was last seen in July 2023, so between this and a very strong overbought signal it’s questionable whether gains will continue at this pace. Most of the time, major forex pairs don’t sustain strong trends for very long. $1.30 is also an unusually talismanic psychological area which probably won’t be broken without some degree of retracement first even if sentiment and fundamentals hold similarly to now.
Dynamic support might come from the 20 and 50 SMAs which are both around $1.272. Although American retail sales for June are due on 16 July, the focus next week is squarely on British data. Cable and other pairs with the pound are likely to be volatile around British inflation on 17 July and the British job report the next day. Until then, the chart suggests reversion to the mean is more favourable than immediate continuation upward.
This article was submitted by Michael Stark, an analyst at Exness.
The opinions in this article are personal to the writer. They do not reflect those of Exness or FX Empire.
This article was originally posted on FX Empire
