
 Yahoo Finance
 What Can We Make Of Watsco, Inc.’s (NYSE:WSO) High Return On Capital?

Today we'll evaluate Watsco, Inc. (NYSE:WSO) to determine whether it could have potential as an investment idea. In particular, we'll consider its Return On Capital Employed (ROCE), as that can give us insight into how profitably the company is able to employ capital in its business.
First of all, we'll work out how to calculate ROCE. Next, we'll compare it to others in its industry. Then we'll determine how its current liabilities are affecting its ROCE.
Understanding Return On Capital Employed (ROCE)
ROCE is a metric for evaluating how much pre-tax income (in percentage terms) a company earns on the capital invested in its business. All else being equal, a better business will have a higher ROCE. Ultimately, it is a useful but imperfect metric. Author Edwin Whiting says to be careful when comparing the ROCE of different businesses, since 'No two businesses are exactly alike.'
So, How Do We Calculate ROCE?
The formula for calculating the return on capital employed is:
Return on Capital Employed = Earnings Before Interest and Tax (EBIT) ÷ (Total Assets - Current Liabilities)
Or for Watsco:
0.18 = US$361m ÷ (US$2.6b - US$581m) (Based on the trailing twelve months to June 2019.)
So, Watsco has an ROCE of 18%.
Check out our latest analysis for Watsco
Is Watsco's ROCE Good?
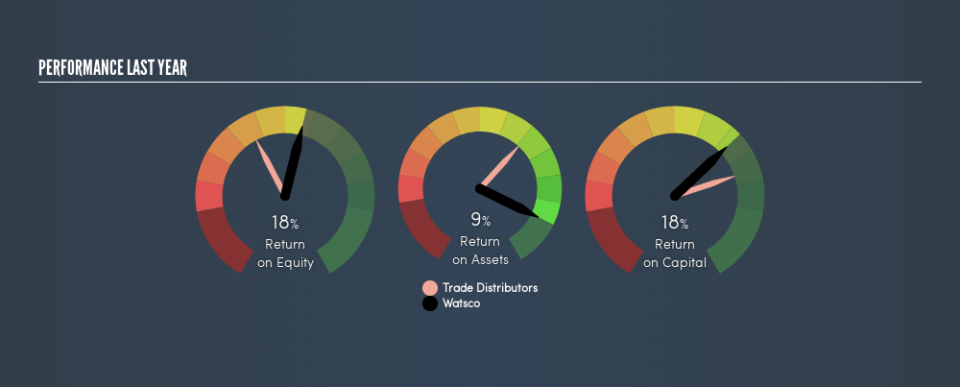
ROCE is commonly used for comparing the performance of similar businesses. Watsco's ROCE appears to be substantially greater than the 8.0% average in the Trade Distributors industry. I think that's good to see, since it implies the company is better than other companies at making the most of its capital. Regardless of where Watsco sits next to its industry, its ROCE in absolute terms appears satisfactory, and this company could be worth a closer look.
You can see in the image below how Watsco's ROCE compares to its industry. Click to see more on past growth.
When considering this metric, keep in mind that it is backwards looking, and not necessarily predictive. ROCE can be deceptive for cyclical businesses, as returns can look incredible in boom times, and terribly low in downturns. ROCE is, after all, simply a snap shot of a single year. Future performance is what matters, and you can see analyst predictions in our free report on analyst forecasts for the company.
What Are Current Liabilities, And How Do They Affect Watsco's ROCE?
Current liabilities include invoices, such as supplier payments, short-term debt, or a tax bill, that need to be paid within 12 months. The ROCE equation subtracts current liabilities from capital employed, so a company with a lot of current liabilities appears to have less capital employed, and a higher ROCE than otherwise. To check the impact of this, we calculate if a company has high current liabilities relative to its total assets.
Watsco has total liabilities of US$581m and total assets of US$2.6b. Therefore its current liabilities are equivalent to approximately 22% of its total assets. A fairly low level of current liabilities is not influencing the ROCE too much.
What We Can Learn From Watsco's ROCE
With that in mind, Watsco's ROCE appears pretty good. There might be better investments than Watsco out there, but you will have to work hard to find them . These promising businesses with rapidly growing earnings might be right up your alley.
I will like Watsco better if I see some big insider buys. While we wait, check out this free list of growing companies with considerable, recent, insider buying.
We aim to bring you long-term focused research analysis driven by fundamental data. Note that our analysis may not factor in the latest price-sensitive company announcements or qualitative material.
If you spot an error that warrants correction, please contact the editor at editorial-team@simplywallst.com. This article by Simply Wall St is general in nature. It does not constitute a recommendation to buy or sell any stock, and does not take account of your objectives, or your financial situation. Simply Wall St has no position in the stocks mentioned. Thank you for reading.
