
 Yahoo Finance
 Be Wary Of Fajarbaru Builder Group Bhd (KLSE:FAJAR) And Its Returns On Capital
If you're looking for a multi-bagger, there's a few things to keep an eye out for. Typically, we'll want to notice a trend of growing return on capital employed (ROCE) and alongside that, an expanding base of capital employed. Basically this means that a company has profitable initiatives that it can continue to reinvest in, which is a trait of a compounding machine. However, after briefly looking over the numbers, we don't think Fajarbaru Builder Group Bhd (KLSE:FAJAR) has the makings of a multi-bagger going forward, but let's have a look at why that may be.
Understanding Return On Capital Employed (ROCE)
For those that aren't sure what ROCE is, it measures the amount of pre-tax profits a company can generate from the capital employed in its business. To calculate this metric for Fajarbaru Builder Group Bhd, this is the formula:
Return on Capital Employed = Earnings Before Interest and Tax (EBIT) ÷ (Total Assets - Current Liabilities)
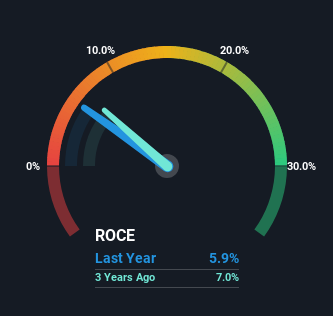
0.059 = RM27m ÷ (RM609m - RM155m) (Based on the trailing twelve months to March 2024).
So, Fajarbaru Builder Group Bhd has an ROCE of 5.9%. In absolute terms, that's a low return and it also under-performs the Construction industry average of 7.7%.
View our latest analysis for Fajarbaru Builder Group Bhd
While the past is not representative of the future, it can be helpful to know how a company has performed historically, which is why we have this chart above. If you're interested in investigating Fajarbaru Builder Group Bhd's past further, check out this free graph covering Fajarbaru Builder Group Bhd's past earnings, revenue and cash flow.
What The Trend Of ROCE Can Tell Us
Unfortunately, the trend isn't great with ROCE falling from 10% five years ago, while capital employed has grown 39%. That being said, Fajarbaru Builder Group Bhd raised some capital prior to their latest results being released, so that could partly explain the increase in capital employed. The funds raised likely haven't been put to work yet so it's worth watching what happens in the future with Fajarbaru Builder Group Bhd's earnings and if they change as a result from the capital raise.
Our Take On Fajarbaru Builder Group Bhd's ROCE
Even though returns on capital have fallen in the short term, we find it promising that revenue and capital employed have both increased for Fajarbaru Builder Group Bhd. And long term investors must be optimistic going forward because the stock has returned a huge 143% to shareholders in the last five years. So while investors seem to be recognizing these promising trends, we would look further into this stock to make sure the other metrics justify the positive view.
If you want to know some of the risks facing Fajarbaru Builder Group Bhd we've found 3 warning signs (1 makes us a bit uncomfortable!) that you should be aware of before investing here.
While Fajarbaru Builder Group Bhd isn't earning the highest return, check out this free list of companies that are earning high returns on equity with solid balance sheets.
Have feedback on this article? Concerned about the content? Get in touch with us directly. Alternatively, email editorial-team (at) simplywallst.com.
This article by Simply Wall St is general in nature. We provide commentary based on historical data and analyst forecasts only using an unbiased methodology and our articles are not intended to be financial advice. It does not constitute a recommendation to buy or sell any stock, and does not take account of your objectives, or your financial situation. We aim to bring you long-term focused analysis driven by fundamental data. Note that our analysis may not factor in the latest price-sensitive company announcements or qualitative material. Simply Wall St has no position in any stocks mentioned.
Have feedback on this article? Concerned about the content? Get in touch with us directly. Alternatively, email editorial-team@simplywallst.com
