
 Yahoo Finance
 Warner Music Group (NASDAQ:WMG) Is Experiencing Growth In Returns On Capital
Did you know there are some financial metrics that can provide clues of a potential multi-bagger? Firstly, we'll want to see a proven return on capital employed (ROCE) that is increasing, and secondly, an expanding base of capital employed. If you see this, it typically means it's a company with a great business model and plenty of profitable reinvestment opportunities. With that in mind, we've noticed some promising trends at Warner Music Group (NASDAQ:WMG) so let's look a bit deeper.
What Is Return On Capital Employed (ROCE)?
If you haven't worked with ROCE before, it measures the 'return' (pre-tax profit) a company generates from capital employed in its business. The formula for this calculation on Warner Music Group is:
Return on Capital Employed = Earnings Before Interest and Tax (EBIT) ÷ (Total Assets - Current Liabilities)
0.15 = US$702m ÷ (US$8.1b - US$3.3b) (Based on the trailing twelve months to December 2022).
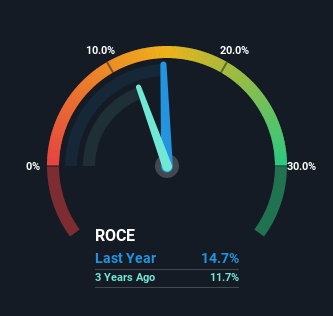
Therefore, Warner Music Group has an ROCE of 15%. On its own, that's a standard return, however it's much better than the 10% generated by the Entertainment industry.
View our latest analysis for Warner Music Group
Above you can see how the current ROCE for Warner Music Group compares to its prior returns on capital, but there's only so much you can tell from the past. If you'd like, you can check out the forecasts from the analysts covering Warner Music Group here for free.
What Does the ROCE Trend For Warner Music Group Tell Us?
We like the trends that we're seeing from Warner Music Group. The numbers show that in the last five years, the returns generated on capital employed have grown considerably to 15%. The company is effectively making more money per dollar of capital used, and it's worth noting that the amount of capital has increased too, by 32%. So we're very much inspired by what we're seeing at Warner Music Group thanks to its ability to profitably reinvest capital.
On a side note, Warner Music Group's current liabilities are still rather high at 41% of total assets. This effectively means that suppliers (or short-term creditors) are funding a large portion of the business, so just be aware that this can introduce some elements of risk. Ideally we'd like to see this reduce as that would mean fewer obligations bearing risks.
What We Can Learn From Warner Music Group's ROCE
All in all, it's terrific to see that Warner Music Group is reaping the rewards from prior investments and is growing its capital base. Given the stock has declined 14% in the last year, this could be a good investment if the valuation and other metrics are also appealing. With that in mind, we believe the promising trends warrant this stock for further investigation.
On a final note, we've found 3 warning signs for Warner Music Group that we think you should be aware of.
If you want to search for solid companies with great earnings, check out this free list of companies with good balance sheets and impressive returns on equity.
Have feedback on this article? Concerned about the content? Get in touch with us directly. Alternatively, email editorial-team (at) simplywallst.com.
This article by Simply Wall St is general in nature. We provide commentary based on historical data and analyst forecasts only using an unbiased methodology and our articles are not intended to be financial advice. It does not constitute a recommendation to buy or sell any stock, and does not take account of your objectives, or your financial situation. We aim to bring you long-term focused analysis driven by fundamental data. Note that our analysis may not factor in the latest price-sensitive company announcements or qualitative material. Simply Wall St has no position in any stocks mentioned.
Join A Paid User Research Session
You’ll receive a US$30 Amazon Gift card for 1 hour of your time while helping us build better investing tools for the individual investors like yourself. Sign up here
