
 Yahoo Finance
 In the wake of XP Inc.'s (NASDAQ:XP) latest US$729m market cap drop, institutional owners may be forced to take severe actions
Key Insights
Significantly high institutional ownership implies XP's stock price is sensitive to their trading actions
51% of the business is held by the top 7 shareholders
Analyst forecasts along with ownership data serve to give a strong idea about prospects for a business
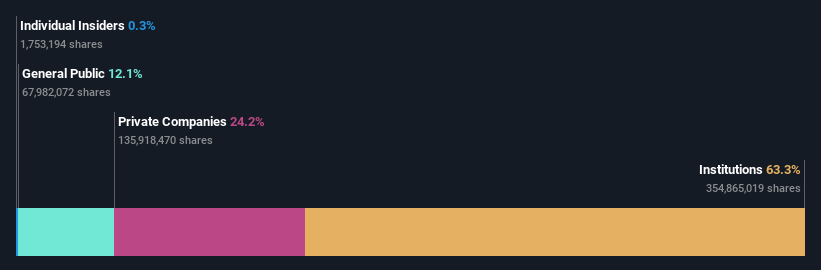
If you want to know who really controls XP Inc. (NASDAQ:XP), then you'll have to look at the makeup of its share registry. We can see that institutions own the lion's share in the company with 63% ownership. In other words, the group stands to gain the most (or lose the most) from their investment into the company.
And institutional investors endured the highest losses after the company's share price fell by 9.8% last week. The recent loss, which adds to a one-year loss of 62% for stockholders, may not sit well with this group of investors. Institutions or "liquidity providers" control large sums of money and therefore, these types of investors usually have a lot of influence over stock price movements. Hence, if weakness in XP's share price continues, institutional investors may feel compelled to sell the stock, which might not be ideal for individual investors.
In the chart below, we zoom in on the different ownership groups of XP.
See our latest analysis for XP
What Does The Institutional Ownership Tell Us About XP?
Institutional investors commonly compare their own returns to the returns of a commonly followed index. So they generally do consider buying larger companies that are included in the relevant benchmark index.
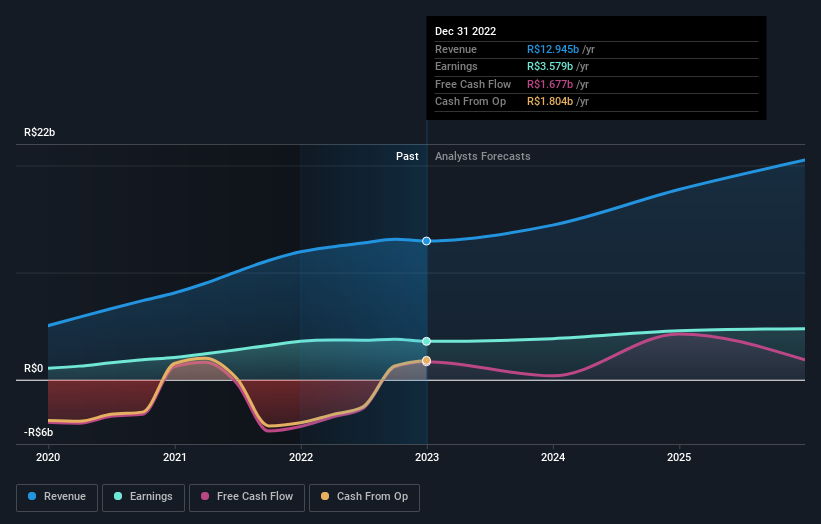
XP already has institutions on the share registry. Indeed, they own a respectable stake in the company. This suggests some credibility amongst professional investors. But we can't rely on that fact alone since institutions make bad investments sometimes, just like everyone does. It is not uncommon to see a big share price drop if two large institutional investors try to sell out of a stock at the same time. So it is worth checking the past earnings trajectory of XP, (below). Of course, keep in mind that there are other factors to consider, too.
Since institutional investors own more than half the issued stock, the board will likely have to pay attention to their preferences. Hedge funds don't have many shares in XP. Looking at our data, we can see that the largest shareholder is XP Control LLC with 18% of shares outstanding. BRL Trust Distribuidora de Títulos e Valores Mobiliários S.A. is the second largest shareholder owning 9.9% of common stock, and Capital Research and Management Company holds about 6.0% of the company stock.
We also observed that the top 7 shareholders account for more than half of the share register, with a few smaller shareholders to balance the interests of the larger ones to a certain extent.
While studying institutional ownership for a company can add value to your research, it is also a good practice to research analyst recommendations to get a deeper understand of a stock's expected performance. There are a reasonable number of analysts covering the stock, so it might be useful to find out their aggregate view on the future.
Insider Ownership Of XP
The definition of an insider can differ slightly between different countries, but members of the board of directors always count. Management ultimately answers to the board. However, it is not uncommon for managers to be executive board members, especially if they are a founder or the CEO.
I generally consider insider ownership to be a good thing. However, on some occasions it makes it more difficult for other shareholders to hold the board accountable for decisions.
Our data suggests that insiders own under 1% of XP Inc. in their own names. But they may have an indirect interest through a corporate structure that we haven't picked up on. Keep in mind that it's a big company, and the insiders own US$21m worth of shares. The absolute value might be more important than the proportional share. It is good to see board members owning shares, but it might be worth checking if those insiders have been buying.
General Public Ownership
With a 12% ownership, the general public, mostly comprising of individual investors, have some degree of sway over XP. This size of ownership, while considerable, may not be enough to change company policy if the decision is not in sync with other large shareholders.
Private Company Ownership
Our data indicates that Private Companies hold 24%, of the company's shares. It's hard to draw any conclusions from this fact alone, so its worth looking into who owns those private companies. Sometimes insiders or other related parties have an interest in shares in a public company through a separate private company.
Next Steps:
It's always worth thinking about the different groups who own shares in a company. But to understand XP better, we need to consider many other factors.
I always like to check for a history of revenue growth. You can too, by accessing this free chart of historic revenue and earnings in this detailed graph.
If you are like me, you may want to think about whether this company will grow or shrink. Luckily, you can check this free report showing analyst forecasts for its future.
NB: Figures in this article are calculated using data from the last twelve months, which refer to the 12-month period ending on the last date of the month the financial statement is dated. This may not be consistent with full year annual report figures.
Have feedback on this article? Concerned about the content? Get in touch with us directly. Alternatively, email editorial-team (at) simplywallst.com.
This article by Simply Wall St is general in nature. We provide commentary based on historical data and analyst forecasts only using an unbiased methodology and our articles are not intended to be financial advice. It does not constitute a recommendation to buy or sell any stock, and does not take account of your objectives, or your financial situation. We aim to bring you long-term focused analysis driven by fundamental data. Note that our analysis may not factor in the latest price-sensitive company announcements or qualitative material. Simply Wall St has no position in any stocks mentioned.
Join A Paid User Research Session
You’ll receive a US$30 Amazon Gift card for 1 hour of your time while helping us build better investing tools for the individual investors like yourself. Sign up here
