
 Yahoo Finance
 Vonovia's (ETR:VNA) growing losses don't faze investors as the stock lifts 3.0% this past week
If you want to compound wealth in the stock market, you can do so by buying an index fund. But investors can boost returns by picking market-beating companies to own shares in. To wit, the Vonovia SE (ETR:VNA) share price is 64% higher than it was a year ago, much better than the market return of around 3.9% (not including dividends) in the same period. So that should have shareholders smiling. Zooming out, the stock is actually down 45% in the last three years.
After a strong gain in the past week, it's worth seeing if longer term returns have been driven by improving fundamentals.
See our latest analysis for Vonovia
In his essay The Superinvestors of Graham-and-Doddsville Warren Buffett described how share prices do not always rationally reflect the value of a business. One flawed but reasonable way to assess how sentiment around a company has changed is to compare the earnings per share (EPS) with the share price.
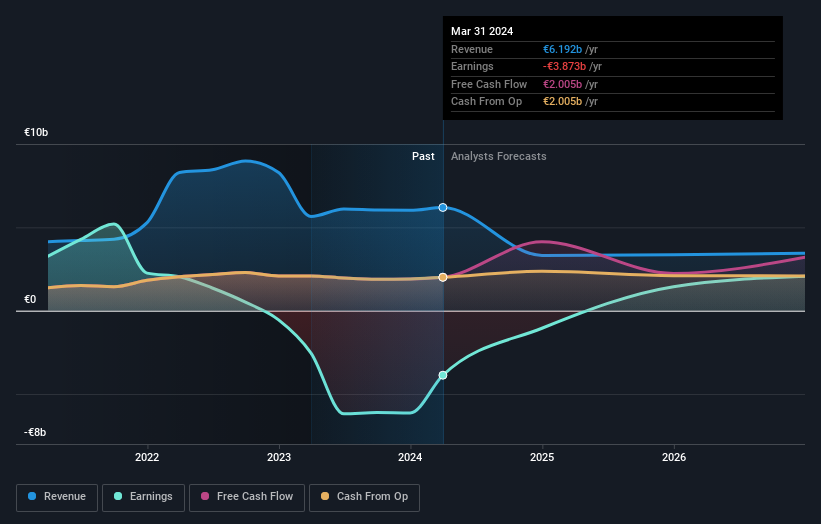
During the last year, Vonovia actually saw its earnings per share drop 48%. We do note that there were extraordinary items impacting the result.
This means it's unlikely the market is judging the company based on earnings growth. Since the change in EPS doesn't seem to correlate with the change in share price, it's worth taking a look at other metrics.
However the year on year revenue growth of 9.6% would help. Many businesses do go through a phase where they have to forgo some profits to drive business development, and sometimes its for the best.
The graphic below depicts how earnings and revenue have changed over time (unveil the exact values by clicking on the image).
Take a more thorough look at Vonovia's financial health with this free report on its balance sheet.
What About Dividends?
When looking at investment returns, it is important to consider the difference between total shareholder return (TSR) and share price return. The TSR is a return calculation that accounts for the value of cash dividends (assuming that any dividend received was reinvested) and the calculated value of any discounted capital raisings and spin-offs. Arguably, the TSR gives a more comprehensive picture of the return generated by a stock. In the case of Vonovia, it has a TSR of 69% for the last 1 year. That exceeds its share price return that we previously mentioned. And there's no prize for guessing that the dividend payments largely explain the divergence!
A Different Perspective
We're pleased to report that Vonovia shareholders have received a total shareholder return of 69% over one year. And that does include the dividend. That certainly beats the loss of about 3% per year over the last half decade. This makes us a little wary, but the business might have turned around its fortunes. While it is well worth considering the different impacts that market conditions can have on the share price, there are other factors that are even more important. For example, we've discovered 3 warning signs for Vonovia (1 is significant!) that you should be aware of before investing here.
But note: Vonovia may not be the best stock to buy. So take a peek at this free list of interesting companies with past earnings growth (and further growth forecast).
Please note, the market returns quoted in this article reflect the market weighted average returns of stocks that currently trade on German exchanges.
Have feedback on this article? Concerned about the content? Get in touch with us directly. Alternatively, email editorial-team (at) simplywallst.com.
This article by Simply Wall St is general in nature. We provide commentary based on historical data and analyst forecasts only using an unbiased methodology and our articles are not intended to be financial advice. It does not constitute a recommendation to buy or sell any stock, and does not take account of your objectives, or your financial situation. We aim to bring you long-term focused analysis driven by fundamental data. Note that our analysis may not factor in the latest price-sensitive company announcements or qualitative material. Simply Wall St has no position in any stocks mentioned.
