
 Yahoo Finance
 What is VIX and How Can You Trade It?
The CBOE Volatility Index (VIX) is a market index used to measure the general volatility of the stock market as implied by the S&P 500 Index Options over time. It is calculated and published by the Chicago Board Options Exchange. Analysts and traders use it to predict how volatile the market is likely to be in the foreseeable future. As such, it has gained many trading names over time including ‘the fear index’, or simply ‘the VIX’ among others.
The VIX uses the S&P 500 Index (SPX) options to capture the expected volatility for the next 30 days. The index uses the two options expirations that have more than 23 days and less than 30 days to narrow down on the 30-day timeframe.
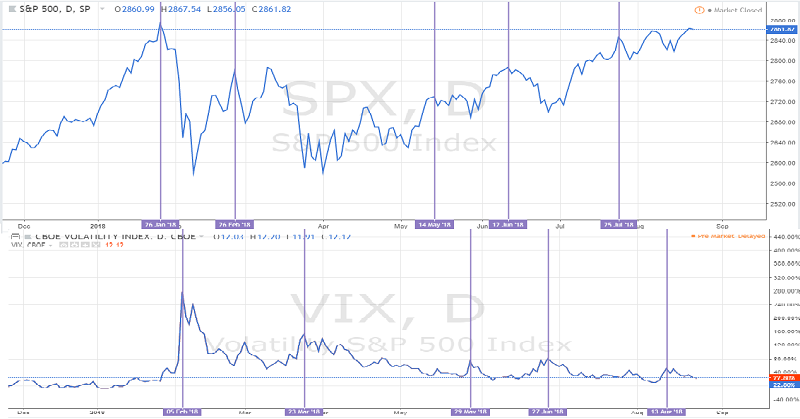
As demonstrated on the charts above, the VIX and the SPX appear to have a direct relationship with significant spikes and curves occurring just about the same time, or within a 30-day period. This white paper the Chicago Board Options Exchange explains the whole relationship properly and also illustrates how the VIX is calculated using the SPX options.
Trading the VIX
So clearly, it looks like trading the VIX would be pretty a simple task. However, as it turns out, you cannot directly trade the VIX. However, as expert traders at Engine forex point out, the two key extremes of the VIX are known ahead of time that makes it a lot more complicated than it visually appears to be. As such, traders try to trade the VIX by trading products that track the volatility index.
Therefore, the market has created various products that traders can use to capitalize on the opportunities created by tracking the VIX. Most of these are ETNs that allow traders to hedge using funds. Some of the notable ETNs in the market today include VelocityShares Daily Inverse VIX Short-Term ETN (XIV) and the iPath S&P 500 VIX Short-Term Futures ETN (VXX).
When using the VXX to hedge against market volatility, analysts and trading experts seem to have a bias towards going long when they anticipate a market correction in the foreseeable future. This decision is usually taken when the VIX appears to bottom indicating that it cannot go any lower.
However, as many traders have found out, this theory does not hold when individual funds and ETNs are involved. Sometimes these have moved lower, even when the VIX appeared to have bottomed, which again illustrates the potential impact of trading an asset that tracks a predictive measure of market volatility.
Therefore, in order to understand better how to trade products that track market volatility, it is important to use a shorter timeframe, in this case, the Volatility Index pegged to short-term S&P 500 Index options, represented by the Mini SPX Index Options (XSP).
It is pretty much like using a narrower window to determine how volatile the market is likely to be for the next few weeks, which is likely to return more accurate results.
In general terms, the VIX has also been used to determine the overall market sentiment and views towards the economy. When the market has a bullish view on the economy, the VIX tends to rise as investors flock to the stock market to invest in capital assets.
This is very well demonstrated in the chart above. Starting in late January 2018 to early February 2018, the market experienced one of the sharpest bull-runs in a long time as speculation hit multi-year highs, and this can be seen on both the S&P 500 Index and the CBOE Volatility Index.
However, what followed shortly after was a period of low market volatility as normalcy returned with most of the investors having exhausted their investment capital. Since then the VIX has traded within what appears to be a tighter range and this indicates high levels of market stability. This is also backed by the steady rally in the market as demonstrated by the SPX.
In summary, the VIX predicts market volatility and due to its wider timeframe, it is hard to target the two extremes making it difficult to trade directly. However, traders have adopted the practice of trading products that track the VIX and as demonstrated on the charts, it tends to pay off some of the time.
This article was originally posted on FX Empire
