
 Yahoo Finance
 Vistra's (NYSE:VST) Returns On Capital Are Heading Higher
If we want to find a potential multi-bagger, often there are underlying trends that can provide clues. Amongst other things, we'll want to see two things; firstly, a growing return on capital employed (ROCE) and secondly, an expansion in the company's amount of capital employed. This shows us that it's a compounding machine, able to continually reinvest its earnings back into the business and generate higher returns. With that in mind, we've noticed some promising trends at Vistra (NYSE:VST) so let's look a bit deeper.
Return On Capital Employed (ROCE): What Is It?
If you haven't worked with ROCE before, it measures the 'return' (pre-tax profit) a company generates from capital employed in its business. The formula for this calculation on Vistra is:
Return on Capital Employed = Earnings Before Interest and Tax (EBIT) ÷ (Total Assets - Current Liabilities)
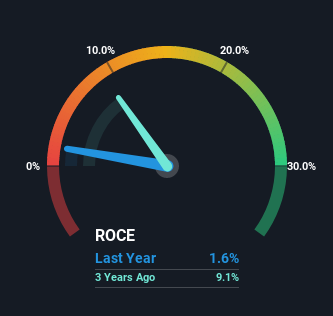
0.016 = US$365m ÷ (US$33b - US$10b) (Based on the trailing twelve months to March 2023).
Thus, Vistra has an ROCE of 1.6%. Even though it's in line with the industry average of 2.4%, it's still a low return by itself.
See our latest analysis for Vistra
In the above chart we have measured Vistra's prior ROCE against its prior performance, but the future is arguably more important. If you'd like, you can check out the forecasts from the analysts covering Vistra here for free.
The Trend Of ROCE
The fact that Vistra is now generating some pre-tax profits from its prior investments is very encouraging. About five years ago the company was generating losses but things have turned around because it's now earning 1.6% on its capital. In addition to that, Vistra is employing 69% more capital than previously which is expected of a company that's trying to break into profitability. This can indicate that there's plenty of opportunities to invest capital internally and at ever higher rates, both common traits of a multi-bagger.
On a side note, we noticed that the improvement in ROCE appears to be partly fueled by an increase in current liabilities. Essentially the business now has suppliers or short-term creditors funding about 32% of its operations, which isn't ideal. Keep an eye out for future increases because when the ratio of current liabilities to total assets gets particularly high, this can introduce some new risks for the business.
Our Take On Vistra's ROCE
In summary, it's great to see that Vistra has managed to break into profitability and is continuing to reinvest in its business. Investors may not be impressed by the favorable underlying trends yet because over the last five years the stock has only returned 20% to shareholders. Given that, we'd look further into this stock in case it has more traits that could make it multiply in the long term.
One final note, you should learn about the 2 warning signs we've spotted with Vistra (including 1 which is a bit concerning) .
While Vistra may not currently earn the highest returns, we've compiled a list of companies that currently earn more than 25% return on equity. Check out this free list here.
Have feedback on this article? Concerned about the content? Get in touch with us directly. Alternatively, email editorial-team (at) simplywallst.com.
This article by Simply Wall St is general in nature. We provide commentary based on historical data and analyst forecasts only using an unbiased methodology and our articles are not intended to be financial advice. It does not constitute a recommendation to buy or sell any stock, and does not take account of your objectives, or your financial situation. We aim to bring you long-term focused analysis driven by fundamental data. Note that our analysis may not factor in the latest price-sensitive company announcements or qualitative material. Simply Wall St has no position in any stocks mentioned.
Join A Paid User Research Session
You’ll receive a US$30 Amazon Gift card for 1 hour of your time while helping us build better investing tools for the individual investors like yourself. Sign up here
