
 Yahoo Finance
 Vistra (NYSE:VST) shareholders have earned a 7.4% CAGR over the last five years
The main point of investing for the long term is to make money. But more than that, you probably want to see it rise more than the market average. Unfortunately for shareholders, while the Vistra Corp. (NYSE:VST) share price is up 27% in the last five years, that's less than the market return. Meanwhile, the last twelve months saw the share price rise 4.1%.
Now it's worth having a look at the company's fundamentals too, because that will help us determine if the long term shareholder return has matched the performance of the underlying business.
View our latest analysis for Vistra
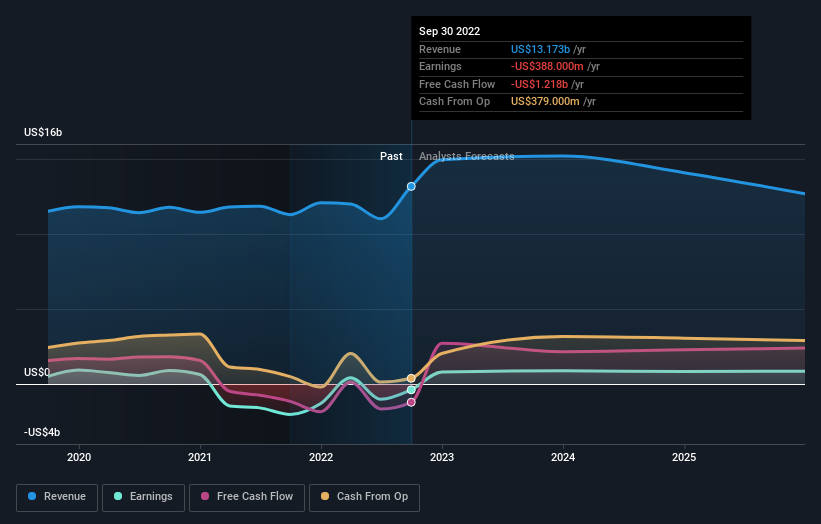
Because Vistra made a loss in the last twelve months, we think the market is probably more focussed on revenue and revenue growth, at least for now. When a company doesn't make profits, we'd generally expect to see good revenue growth. That's because fast revenue growth can be easily extrapolated to forecast profits, often of considerable size.
For the last half decade, Vistra can boast revenue growth at a rate of 13% per year. That's a pretty good long term growth rate. While the share price has gained 5% per year for five years, that's hardly amazing considering the market also rose. You could even argue that the share price was over optimistic, previously.
The graphic below depicts how earnings and revenue have changed over time (unveil the exact values by clicking on the image).
It's probably worth noting we've seen significant insider buying in the last quarter, which we consider a positive. On the other hand, we think the revenue and earnings trends are much more meaningful measures of the business. If you are thinking of buying or selling Vistra stock, you should check out this free report showing analyst profit forecasts.
What About Dividends?
As well as measuring the share price return, investors should also consider the total shareholder return (TSR). The TSR incorporates the value of any spin-offs or discounted capital raisings, along with any dividends, based on the assumption that the dividends are reinvested. Arguably, the TSR gives a more comprehensive picture of the return generated by a stock. In the case of Vistra, it has a TSR of 43% for the last 5 years. That exceeds its share price return that we previously mentioned. And there's no prize for guessing that the dividend payments largely explain the divergence!
A Different Perspective
It's good to see that Vistra has rewarded shareholders with a total shareholder return of 7.4% in the last twelve months. And that does include the dividend. However, the TSR over five years, coming in at 7% per year, is even more impressive. While it is well worth considering the different impacts that market conditions can have on the share price, there are other factors that are even more important. For instance, we've identified 2 warning signs for Vistra (1 is potentially serious) that you should be aware of.
If you like to buy stocks alongside management, then you might just love this free list of companies. (Hint: insiders have been buying them).
Please note, the market returns quoted in this article reflect the market weighted average returns of stocks that currently trade on US exchanges.
Have feedback on this article? Concerned about the content? Get in touch with us directly. Alternatively, email editorial-team (at) simplywallst.com.
This article by Simply Wall St is general in nature. We provide commentary based on historical data and analyst forecasts only using an unbiased methodology and our articles are not intended to be financial advice. It does not constitute a recommendation to buy or sell any stock, and does not take account of your objectives, or your financial situation. We aim to bring you long-term focused analysis driven by fundamental data. Note that our analysis may not factor in the latest price-sensitive company announcements or qualitative material. Simply Wall St has no position in any stocks mentioned.
Join A Paid User Research Session
You’ll receive a US$30 Amazon Gift card for 1 hour of your time while helping us build better investing tools for the individual investors like yourself. Sign up here
