
 Yahoo Finance
 Vista Group International (NZSE:VGL) shareholders have endured a 57% loss from investing in the stock five years ago
While not a mind-blowing move, it is good to see that the Vista Group International Limited (NZSE:VGL) share price has gained 21% in the last three months. But don't envy holders -- looking back over 5 years the returns have been really bad. In fact, the share price has declined rather badly, down some 60% in that time. Some might say the recent bounce is to be expected after such a bad drop. We'd err towards caution given the long term under-performance.
So let's have a look and see if the longer term performance of the company has been in line with the underlying business' progress.
View our latest analysis for Vista Group International
Vista Group International isn't currently profitable, so most analysts would look to revenue growth to get an idea of how fast the underlying business is growing. Shareholders of unprofitable companies usually desire strong revenue growth. Some companies are willing to postpone profitability to grow revenue faster, but in that case one would hope for good top-line growth to make up for the lack of earnings.
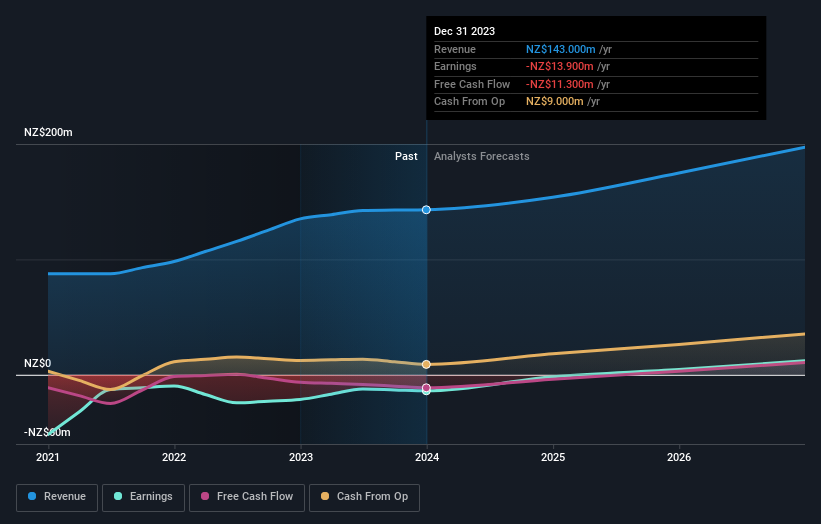
In the last half decade, Vista Group International saw its revenue increase by 0.5% per year. That's not a very high growth rate considering it doesn't make profits. It's likely this weak growth has contributed to an annualised return of 10% for the last five years. We want to see an acceleration of revenue growth (or profits) before showing much interest in this one. However, it's possible too many in the market will ignore it, and there may be an opportunity if it starts to recover down the track.
You can see below how earnings and revenue have changed over time (discover the exact values by clicking on the image).
Take a more thorough look at Vista Group International's financial health with this free report on its balance sheet.
What About The Total Shareholder Return (TSR)?
We'd be remiss not to mention the difference between Vista Group International's total shareholder return (TSR) and its share price return. The TSR attempts to capture the value of dividends (as if they were reinvested) as well as any spin-offs or discounted capital raisings offered to shareholders. Its history of dividend payouts mean that Vista Group International's TSR, which was a 57% drop over the last 5 years, was not as bad as the share price return.
A Different Perspective
We're pleased to report that Vista Group International shareholders have received a total shareholder return of 51% over one year. There's no doubt those recent returns are much better than the TSR loss of 9% per year over five years. We generally put more weight on the long term performance over the short term, but the recent improvement could hint at a (positive) inflection point within the business. While it is well worth considering the different impacts that market conditions can have on the share price, there are other factors that are even more important. For instance, we've identified 1 warning sign for Vista Group International that you should be aware of.
Of course, you might find a fantastic investment by looking elsewhere. So take a peek at this free list of companies we expect will grow earnings.
Please note, the market returns quoted in this article reflect the market weighted average returns of stocks that currently trade on New Zealander exchanges.
Have feedback on this article? Concerned about the content? Get in touch with us directly. Alternatively, email editorial-team (at) simplywallst.com.
This article by Simply Wall St is general in nature. We provide commentary based on historical data and analyst forecasts only using an unbiased methodology and our articles are not intended to be financial advice. It does not constitute a recommendation to buy or sell any stock, and does not take account of your objectives, or your financial situation. We aim to bring you long-term focused analysis driven by fundamental data. Note that our analysis may not factor in the latest price-sensitive company announcements or qualitative material. Simply Wall St has no position in any stocks mentioned.
