
 Yahoo Finance
 Vipshop Holdings (NYSE:VIPS) earnings and shareholder returns have been trending downwards for the last year, but the stock soars 16% this past week
This week we saw the Vipshop Holdings Limited (NYSE:VIPS) share price climb by 16%. But that hardly compensates for the shocking decline over the last twelve months. To wit, the stock has dropped 72% over the last year. So the rise may not be much consolation. The important thing is whether the company can turn it around, longer term.
Although the past week has been more reassuring for shareholders, they're still in the red over the last year, so let's see if the underlying business has been responsible for the decline.
Check out our latest analysis for Vipshop Holdings
In his essay The Superinvestors of Graham-and-Doddsville Warren Buffett described how share prices do not always rationally reflect the value of a business. One imperfect but simple way to consider how the market perception of a company has shifted is to compare the change in the earnings per share (EPS) with the share price movement.
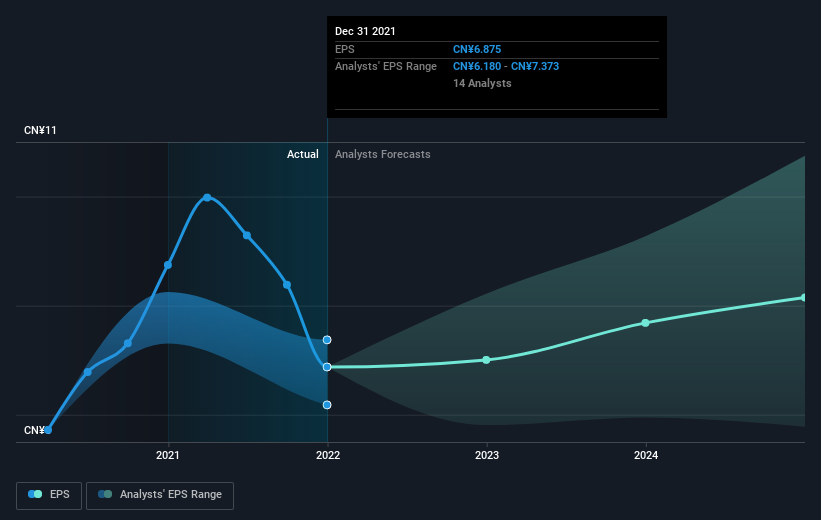
Unfortunately Vipshop Holdings reported an EPS drop of 21% for the last year. This reduction in EPS is not as bad as the 72% share price fall. This suggests the EPS fall has made some shareholders are more nervous about the business. The P/E ratio of 7.73 also points to the negative market sentiment.
You can see below how EPS has changed over time (discover the exact values by clicking on the image).
It is of course excellent to see how Vipshop Holdings has grown profits over the years, but the future is more important for shareholders. If you are thinking of buying or selling Vipshop Holdings stock, you should check out this FREE detailed report on its balance sheet.
A Different Perspective
We regret to report that Vipshop Holdings shareholders are down 72% for the year. Unfortunately, that's worse than the broader market decline of 2.8%. However, it could simply be that the share price has been impacted by broader market jitters. It might be worth keeping an eye on the fundamentals, in case there's a good opportunity. Unfortunately, last year's performance may indicate unresolved challenges, given that it was worse than the annualised loss of 7% over the last half decade. We realise that Baron Rothschild has said investors should "buy when there is blood on the streets", but we caution that investors should first be sure they are buying a high quality business. It's always interesting to track share price performance over the longer term. But to understand Vipshop Holdings better, we need to consider many other factors. To that end, you should be aware of the 2 warning signs we've spotted with Vipshop Holdings .
We will like Vipshop Holdings better if we see some big insider buys. While we wait, check out this free list of growing companies with considerable, recent, insider buying.
Please note, the market returns quoted in this article reflect the market weighted average returns of stocks that currently trade on US exchanges.
Have feedback on this article? Concerned about the content? Get in touch with us directly. Alternatively, email editorial-team (at) simplywallst.com.
This article by Simply Wall St is general in nature. We provide commentary based on historical data and analyst forecasts only using an unbiased methodology and our articles are not intended to be financial advice. It does not constitute a recommendation to buy or sell any stock, and does not take account of your objectives, or your financial situation. We aim to bring you long-term focused analysis driven by fundamental data. Note that our analysis may not factor in the latest price-sensitive company announcements or qualitative material. Simply Wall St has no position in any stocks mentioned.
