
 Yahoo Finance
 Vermilion Energy Inc.'s (TSE:VET) Stock Has Been Sliding But Fundamentals Look Strong: Is The Market Wrong?
With its stock down 30% over the past three months, it is easy to disregard Vermilion Energy (TSE:VET). However, stock prices are usually driven by a company’s financial performance over the long term, which in this case looks quite promising. Specifically, we decided to study Vermilion Energy's ROE in this article.
ROE or return on equity is a useful tool to assess how effectively a company can generate returns on the investment it received from its shareholders. In short, ROE shows the profit each dollar generates with respect to its shareholder investments.
See our latest analysis for Vermilion Energy
How To Calculate Return On Equity?
ROE can be calculated by using the formula:
Return on Equity = Net Profit (from continuing operations) ÷ Shareholders' Equity
So, based on the above formula, the ROE for Vermilion Energy is:
44% = CA$1.3b ÷ CA$2.9b (Based on the trailing twelve months to September 2022).
The 'return' is the yearly profit. So, this means that for every CA$1 of its shareholder's investments, the company generates a profit of CA$0.44.
What Is The Relationship Between ROE And Earnings Growth?
Thus far, we have learned that ROE measures how efficiently a company is generating its profits. We now need to evaluate how much profit the company reinvests or "retains" for future growth which then gives us an idea about the growth potential of the company. Assuming everything else remains unchanged, the higher the ROE and profit retention, the higher the growth rate of a company compared to companies that don't necessarily bear these characteristics.
Vermilion Energy's Earnings Growth And 44% ROE
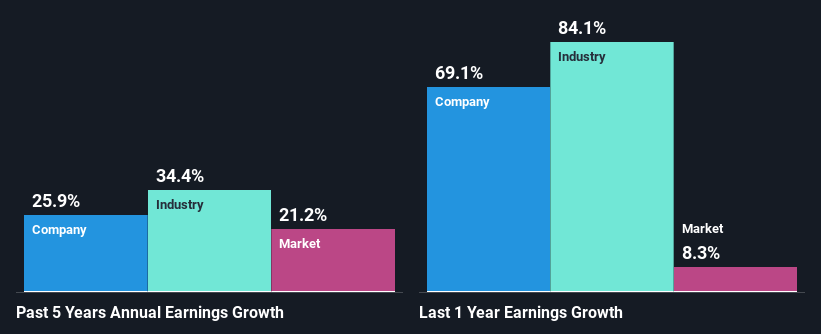
First thing first, we like that Vermilion Energy has an impressive ROE. Second, a comparison with the average ROE reported by the industry of 25% also doesn't go unnoticed by us. Under the circumstances, Vermilion Energy's considerable five year net income growth of 26% was to be expected.
As a next step, we compared Vermilion Energy's net income growth with the industry and were disappointed to see that the company's growth is lower than the industry average growth of 34% in the same period.
The basis for attaching value to a company is, to a great extent, tied to its earnings growth. What investors need to determine next is if the expected earnings growth, or the lack of it, is already built into the share price. By doing so, they will have an idea if the stock is headed into clear blue waters or if swampy waters await. One good indicator of expected earnings growth is the P/E ratio which determines the price the market is willing to pay for a stock based on its earnings prospects. So, you may want to check if Vermilion Energy is trading on a high P/E or a low P/E, relative to its industry.
Is Vermilion Energy Efficiently Re-investing Its Profits?
Vermilion Energy's LTM (or last twelve month) payout ratio to shareholders is 2.6%, which is quite low. This implies that the company is retaining 97% of its profits. This suggests that the management is reinvesting most of the profits to grow the business as evidenced by the growth seen by the company.
Besides, Vermilion Energy has been paying dividends for at least ten years or more. This shows that the company is committed to sharing profits with its shareholders. Upon studying the latest analysts' consensus data, we found that the company's future payout ratio is expected to rise to 8.5% over the next three years. Accordingly, the expected increase in the payout ratio explains the expected decline in the company's ROE to 27%, over the same period.
Conclusion
Overall, we are quite pleased with Vermilion Energy's performance. Particularly, we like that the company is reinvesting heavily into its business, and at a high rate of return. As a result, the decent growth in its earnings is not surprising. Having said that, on studying current analyst estimates, we were concerned to see that while the company has grown its earnings in the past, analysts expect its earnings to shrink in the future. Are these analysts expectations based on the broad expectations for the industry, or on the company's fundamentals? Click here to be taken to our analyst's forecasts page for the company.
Have feedback on this article? Concerned about the content? Get in touch with us directly. Alternatively, email editorial-team (at) simplywallst.com.
This article by Simply Wall St is general in nature. We provide commentary based on historical data and analyst forecasts only using an unbiased methodology and our articles are not intended to be financial advice. It does not constitute a recommendation to buy or sell any stock, and does not take account of your objectives, or your financial situation. We aim to bring you long-term focused analysis driven by fundamental data. Note that our analysis may not factor in the latest price-sensitive company announcements or qualitative material. Simply Wall St has no position in any stocks mentioned.
Join A Paid User Research Session
You’ll receive a US$30 Amazon Gift card for 1 hour of your time while helping us build better investing tools for the individual investors like yourself. Sign up here
