
 Yahoo Finance
 Is Vail Resorts, Inc.’s (NYSE:MTN) Balance Sheet Strong Enough To Weather A Storm?

Want to participate in a short research study? Help shape the future of investing tools and receive a $20 prize!
Small and large cap stocks are widely popular for a variety of reasons, however, mid-cap companies such as Vail Resorts, Inc. (NYSE:MTN), with a market cap of US$8.4b, often get neglected by retail investors. However, generally ignored mid-caps have historically delivered better risk adjusted returns than both of those groups. Today we will look at MTN’s financial liquidity and debt levels, which are strong indicators for whether the company can weather economic downturns or fund strategic acquisitions for future growth. Don’t forget that this is a general and concentrated examination of Vail Resorts’s financial health, so you should conduct further analysis into MTN here.
View our latest analysis for Vail Resorts
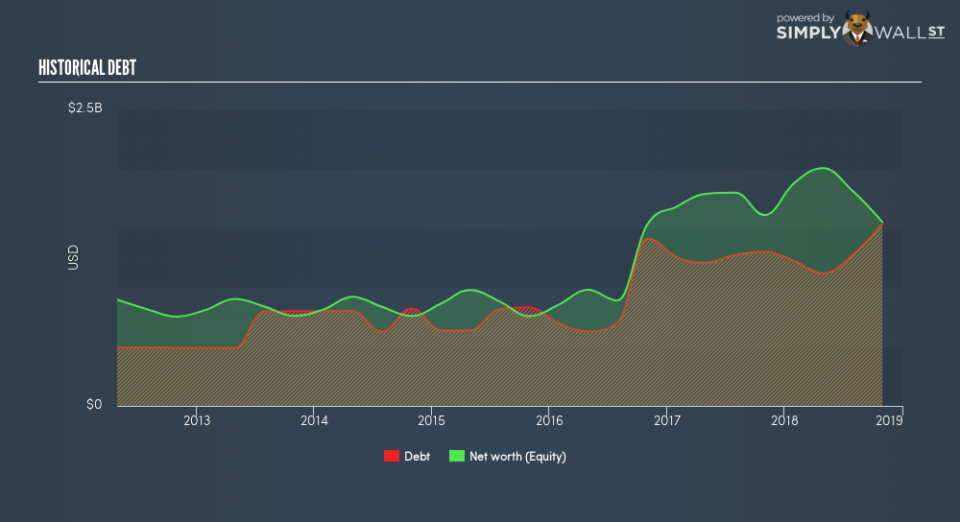
How much cash does MTN generate through its operations?
MTN has built up its total debt levels in the last twelve months, from US$1.3b to US$1.5b , which accounts for long term debt. With this increase in debt, MTN’s cash and short-term investments stands at US$141m for investing into the business. On top of this, MTN has generated cash from operations of US$573m over the same time period, leading to an operating cash to total debt ratio of 37%, meaning that MTN’s operating cash is sufficient to cover its debt. This ratio can also be a sign of operational efficiency as an alternative to return on assets. In MTN’s case, it is able to generate 0.37x cash from its debt capital.
Can MTN pay its short-term liabilities?
Looking at MTN’s US$790m in current liabilities, it appears that the company may not have an easy time meeting these commitments with a current assets level of US$393m, leading to a current ratio of 0.5x.
Is MTN’s debt level acceptable?
With a debt-to-equity ratio of 99%, MTN can be considered as an above-average leveraged company. This is not uncommon for a mid-cap company given that debt tends to be lower-cost and at times, more accessible. No matter how high the company’s debt, if it can easily cover the interest payments, it’s considered to be efficient with its use of excess leverage. A company generating earnings after interest and tax at least three times its net interest payments is considered financially sound. In MTN’s case, the ratio of 6.12x suggests that interest is appropriately covered, which means that debtors may be willing to loan the company more money, giving MTN ample headroom to grow its debt facilities.
Next Steps:
Although MTN’s debt level is towards the higher end of the spectrum, its cash flow coverage seems adequate to meet debt obligations which means its debt is being efficiently utilised. However, its lack of liquidity raises questions over current asset management practices for the mid-cap. I admit this is a fairly basic analysis for MTN’s financial health. Other important fundamentals need to be considered alongside. I suggest you continue to research Vail Resorts to get a more holistic view of the stock by looking at:
Future Outlook: What are well-informed industry analysts predicting for MTN’s future growth? Take a look at our free research report of analyst consensus for MTN’s outlook.
Valuation: What is MTN worth today? Is the stock undervalued, even when its growth outlook is factored into its intrinsic value? The intrinsic value infographic in our free research report helps visualize whether MTN is currently mispriced by the market.
Other High-Performing Stocks: Are there other stocks that provide better prospects with proven track records? Explore our free list of these great stocks here.
We aim to bring you long-term focused research analysis driven by fundamental data. Note that our analysis may not factor in the latest price-sensitive company announcements or qualitative material.
If you spot an error that warrants correction, please contact the editor at editorial-team@simplywallst.com. This article by Simply Wall St is general in nature. It does not constitute a recommendation to buy or sell any stock, and does not take account of your objectives, or your financial situation. Simply Wall St has no position in the stocks mentioned. Thank you for reading.
