
 Yahoo Finance
 USDOLLAR Nears 200 Day Average
DailyFX.com -
Daily
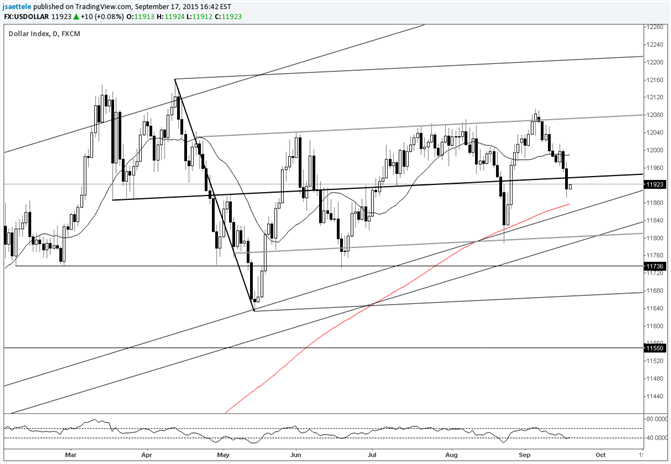
Chart Prepared by Jamie Saettele, CMT
Automate trades with Mirror Trader and see ideas on other USD crosses
-The USDOLLAR dropped sharply into a line that has been support at many important lows since the all-time low in 2011. As long as the line holds (along with the 200 day average…red line), the sideways trade of the last 6 months should be viewed in a bullish context (although at resistance today (9/3)). If this technical levels fail, then the first important correction since the USDOLLAR broke out in September 2014 is underway and the pain felt should be severe.
For more analysis and trade setups (exact entry and exit), visit SB Trade Desk
DailyFX provides forex news and technical analysis on the trends that influence the global currency markets.
Learn forex trading with a free practice account and trading charts from FXCM.
