
 Yahoo Finance
 USD/JPY Forex Technical Analysis – Trader Reaction to 108.851 Sets the Tone on Wednesday
The Dollar/Yen is edging lower on Wednesday after spiking to nearly a two-month high the previous session. The Japanese Yen fell to a seven-week low against the U.S. Dollar on Tuesday as risk appetite grew on optimism that the worst of the economic downturn from the spread of the coronavirus is in the past.
At 05:03 GMT, the USD/JPY is trading 108.525, down 0.153 or -0.14%.
Helping to reduce the Yen’s appeal as a safe-haven asset was strength in the global equity markets and a jump in U.S. Treasury yields. The rise in U.S. 10-Year Treasury Bond yields widened the spread with the Japanese Government Bond yield. This made the U.S. Dollar a more attractive asset.
Daily Swing Chart Technical Analysis
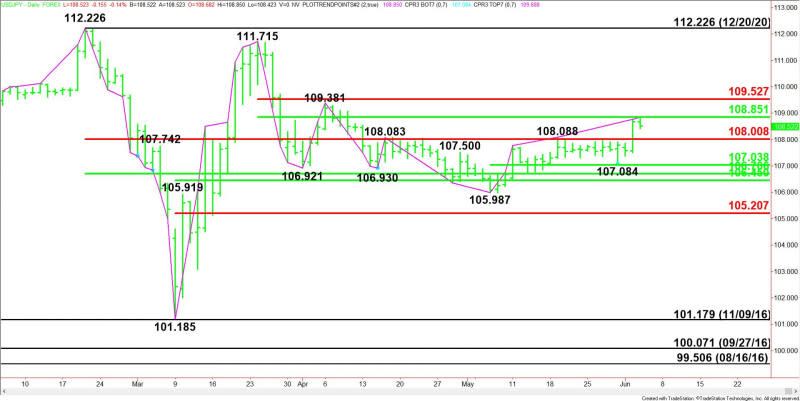
The main trend is up according to the daily swing chart. After trading sideways for nine weeks, the USD/JPY resumed the uptrend when buyers took out the last main high at 108.088. A trade through 105.987 will change the main trend to down.
The main range is 112.226 to 101.185. Its retracement zone at 106.706 to 108.008 is controlling the near-term direction of the USD/JPY. Holding above this zone will sustain the upside bias. The zone is also new support.
The short-term range is 111.715 to 105.987. Its retracement zone at 108.851 to 109.527 is the primary upside target. Additional resistance is the next main top at 109.381.
Daily Swing Chart Technical Forecast
Based on the early price action and the last price at 108.525, the direction of the USD/JPY the rest of the session on Wednesday is likely to be determined by trader reaction to the short-term 50% level at 108.851.
Bullish Scenario
A sustained move over 108.851 will indicate the presence of buyers. If this move creates enough upside momentum then look for the rally to possibly extend into the main top at 109.381, followed by the short-term 50% level at 109.527.
Bearish Scenario
A sustained move under 108.851 will signal the presence of sellers. This could trigger a break into the Fibonacci level at 108.008.
For a look at all of today’s economic events, check out our economic calendar.
This article was originally posted on FX Empire
