
 Yahoo Finance
 USD/CHF Technical Analysis: The Range within the Trend
DailyFX.com -
To receive James Stanley’s Analysis directly via email, please sign up here.
Talking Points:
USD/CHF Technical Strategy: Flat.
USD/CHF has held higher-low support, but a major Fibonacci level looms just ~40 pips above current price action.
If you’re looking for trade ideas, check out our Trading Guides; they’re free.
SSI remains stretched in USD/CHF by a tune of >+1.4-to-1. Click here to learn more about SSI.
In our last article, we looked at the building up-trend being seen in USD/CHF after a fresh two-month-high had taken out out the prior swing at .9795. And while much of this move was related to the resurgence in the Greenback that’s been seen since the beginning of May, few pairs have reflected this USD strength as cleanly as the Swissy.
But looming just ~35 pips away we have a major Fibonacci level that’s shown a tendency to support and resist prices in the four-plus years since its formation. This is the level of .9948, and it’s the 38.2% retracement of the ‘secondary move’ in USD/CHF, which takes the 2010 high to the 2011 low. This level had provided the swing high in the year 2012, and didn’t become eclipsed again until early 2015. This is a significant price level on USD/CHF, and given the near-term bias in the pair (up-trend), traders may want to approach such a resistance level with caution, particularly for longer-term strategies.
For those looking to establish longer-term positions, observe price action behavior around this key level. As in, if we can get a clean break above .9948, we have the parity level just a little higher. This could be ample opportunity to look for a ‘lower high’ around this zone of prior resistance should new highs come into play.
Conversely, for traders comfortable playing shorter-term strategies, they can look at playing the shorter-term range that’s developed; looking to buy support or, in essence, looking to apply range-bound logic to a trending pair. This would entail getting long after a support inflection off of the .9887 Fibonacci support level, which is the 61.8% retracement of the prior major move, taking the January 2016 high to the February 2016 low (this retracement is shown in green on the below chart). Key would be stop placement, as a target to .9948 may offer less than 50 pips of possible upside after that support confirms, which would mean a stop of less than 25 pips for those looking to get a minimum 1-2 risk-reward ratio.
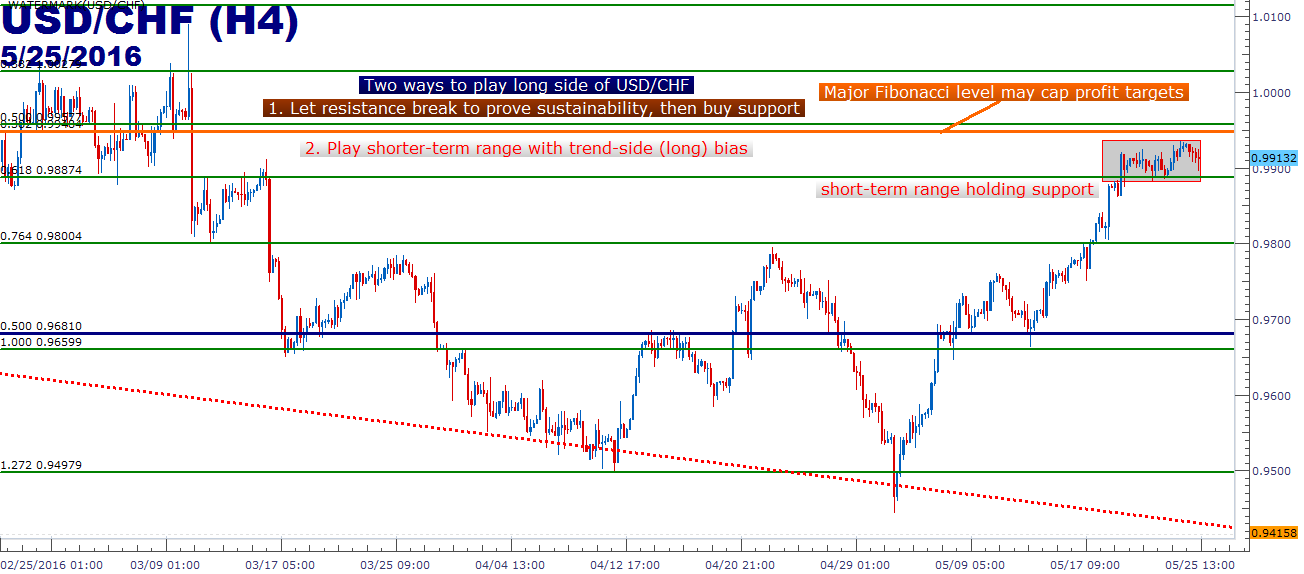
Created with Marketscope/Trading Station II; prepared by James Stanley
--- Written by James Stanley, Analyst for DailyFX.com
To receive James Stanley’s analysis directly via email, please SIGN UP HERE
Contact and follow James on Twitter: @JStanleyFX
DailyFX provides forex news and technical analysis on the trends that influence the global currency markets.
Learn forex trading with a free practice account and trading charts from FXCM.
