Advertisement
Australia markets close in 5 hours 6 minutes
  • ALL ORDS

    7,892.00
    +31.00 (+0.39%)
     
  • ASX 200

    7,635.80
    +30.20 (+0.40%)
     
  • AUD/USD

    0.6444
    +0.0007 (+0.11%)
     
  • OIL

    82.69
    0.00 (0.00%)
     
  • GOLD

    2,383.50
    -4.90 (-0.21%)
     
  • Bitcoin AUD

    95,572.32
    -3,797.12 (-3.82%)
     
  • CMC Crypto 200

    885.54
    0.00 (0.00%)
     
  • AUD/EUR

    0.6036
    +0.0010 (+0.17%)
     
  • AUD/NZD

    1.0889
    +0.0016 (+0.15%)
     
  • NZX 50

    11,812.05
    -63.30 (-0.53%)
     
  • NASDAQ

    17,493.62
    -220.04 (-1.24%)
     
  • FTSE

    7,847.99
    +27.63 (+0.35%)
     
  • Dow Jones

    37,753.31
    -45.66 (-0.12%)
     
  • DAX

    17,770.02
    +3.79 (+0.02%)
     
  • Hang Seng

    16,251.84
    +2.87 (+0.02%)
     
  • NIKKEI 225

    37,755.57
    -206.23 (-0.54%)
     

USD/CHF 200 Day Average Trying to Hold Again

DailyFX.com -

Daily

USD/CHF 200 Day Average Trying to Hold Again

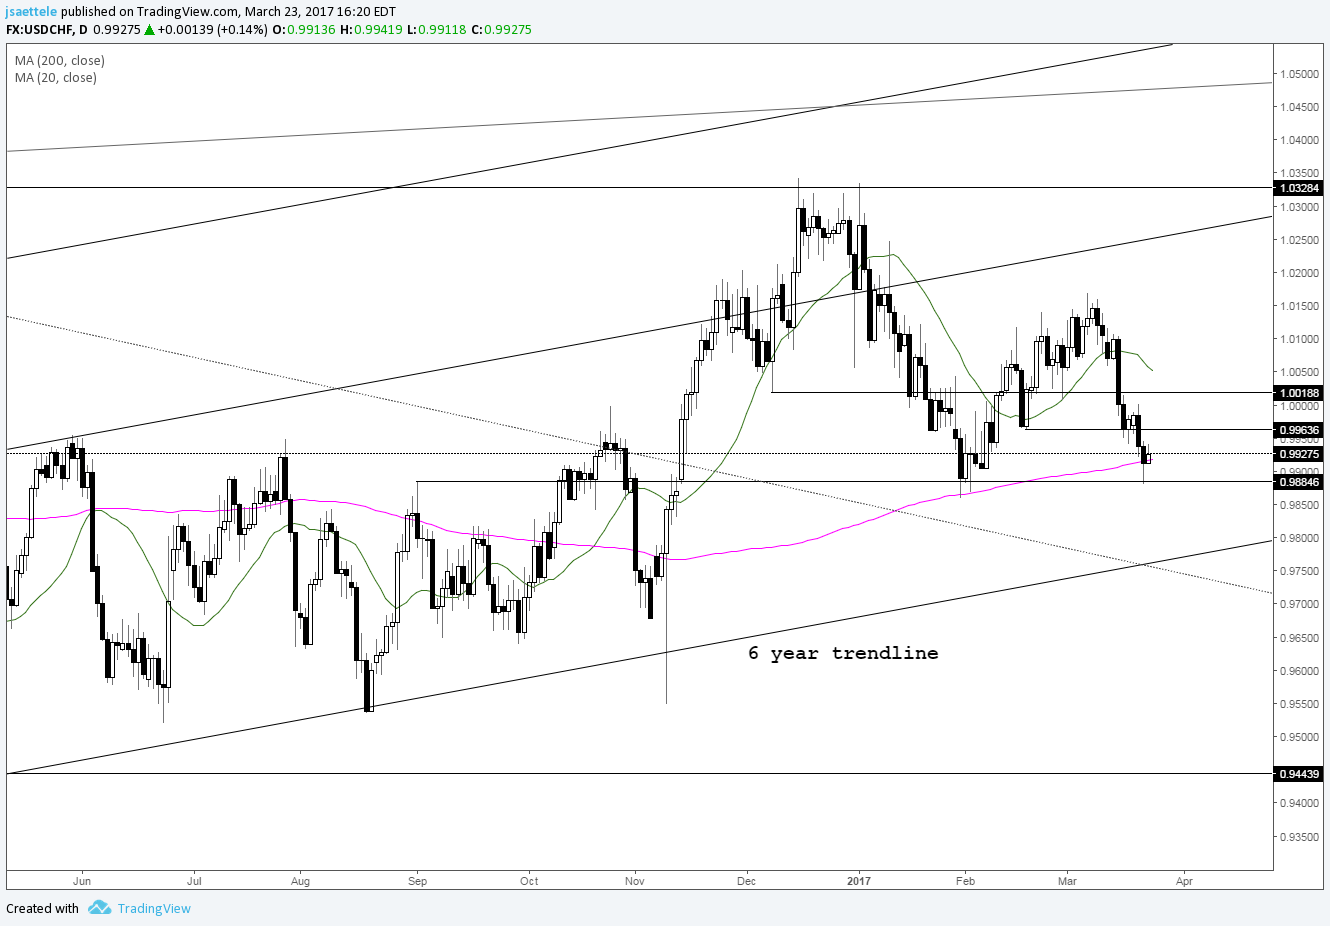
Chart Prepared by Jamie Saettele, CMT

DailyFX Trading Guides and Forecasts

-“Remember, USD/CHF topped on 3/11 and 3/10 the last 2 years. Might USD/CHF be set up to fail around the same date this year? .9964 is the short term pivot (below is bearish).” The top came early this year (3/7) and price has traded below .9964. As such, trend is lower towards the 6 year trendline. I wrote last update that “the 200 day average is just below the market and could influence for some back and fill”. Swissie is backing and filling (trading sideways) but risk remains for lower levels as per the drop under .9964 (watch that level for resistance).

ADVERTISEMENT


original source

DailyFX provides forex news and technical analysis on the trends that influence the global currency markets.
Learn forex trading with a free practice account and trading charts from IG.