
 Yahoo Finance
 US DOLLAR Technical Analysis: Let The USD Pain Trade Begin?
DailyFX.com -
To See How FXCM’s Live Clients Are Positioned In FX & Equities Click Here Now
Talking Points:
US Dollar Technical Strategy: A High-Low + Breakout = USD Bull Return
Aggressive Break Above 12,000 Favors a Resumption of the Pain Trade
Are You Ready To Watch Another Opening Range Breakout?
Since February, it appears that central banks have been interested in keeping down the value of the US dollar. The fear and no uncertain words were whether or not the market would take back the US dollar’s market value from the Central Banks and most notably the Fed. After the EU referendum outcome had shown the United Kingdom would be parting ways with the world’s largest single market in the euro zone, fear sent money out of sterling and other risk assets and into risk off currencies and the US Dollar.
Given the technical picture on the charts, we recently printed a higher low that causes one to wonder whether we just saw a triple-bottom that could now see a significant reversal in the works. Below, we will share some the building blocks of a US dollar breakout as well as what levels to watch, and what other markets could complement such a strong move.
Compete to Win Cash Prizes With Your FXCM Mini Account, Click Here For More Info
Either way, much of the market environment over the last few months has been built on a weak US Dollar so a reversal could put further pressure on risk assets like commodities and stocks if a true dollar breakout is in the works.
The Fundamentals And Technical Picture May Be Aligning to US Dollar Strength

The chart above shows how aggressive the move lower has been since post-Brexit. In two days, we’ve taken out for months of corrective price action that could signal a new and aggressive bull market is underway in the US dollar.
We have long discussed the importance of the 12,000 level on the chart, and the recent break of this level off of the price range of the May 2015 low suggests the potential triple bottom price action pattern. If this pattern is playing out, we would expect an equal move the size of the range above the recent 2016 high of 12,306.

The Bearish channel (red) has done a fine job of framing price action. When combining the bearish price channel with the 200-Day Moving Average (12,025), you can begin to see that we are still in a corrective price channel in the setback may soon occur, but overall the strength of the move and resistance should favor the Bulls.
To receive Tyler’s analysis directly via email, please SIGN UP HERE
June Support & Resistance Levels As of June 27, 2016
Friday’s move broke above resistance at the opening range high is 11,998. This level was a clean bracket to sentiment as the key resistance we’ve been watching (highlighted on the chart above) is the 12,000 zone where many pivots have occurred since topping out in late January.
We’ve warned that even a dire fundamental picture in the US regarding expected interest rate hikes (a fundamental driver of currency strength) could be swept aside with a break above the 12,000 zone. Now that this has happened, attention should be focused on further US Dollar upside.
Now, it is worth watching the opening range of July, which is also the opening range for the second half of 2016 to see if dollar strength extends. If so, we could be looking at market stresses similar to late 2008 and the uncomfortable ripple effects to follow. Only this time, most central banks have only a few bullets in the gun if any, which could bring up the dollar strength even more.
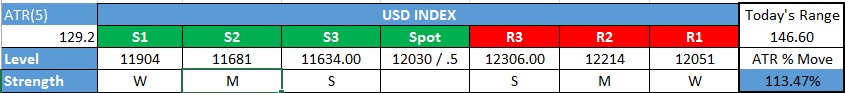
Shorter-Term US Dollar Technical Levels for Monday, June 27, 2016
For those interested in shorter-term levels of focus than the ones above, these levels signal important potential pivot levels over the next 48-hours of trading.
As a special warning, the EU referendum promises to bring volatility across the board. It is expected that markets could be illiquid as people shy away from the risks that bring with it volatility. Therefore, the diagram below has wider levels than usual to adjust to possible illiquid and volatile markets.
Interested In our Analyst’s Longer-Term Dollar Outlook? Please sign up for our free dollar guide here.
T.Y.
DailyFX provides forex news and technical analysis on the trends that influence the global currency markets.
Learn forex trading with a free practice account and trading charts from FXCM.
