
 Yahoo Finance
 US Dollar Index (DX) Futures Technical Analysis – Closing Price Reversal Bottom Signals Potential Shift in Momentum
March U.S. Dollar Index futures rebounded from a three-year low on Friday, but still managed to post its biggest weekly loss in nine months. Negative sentiment due to worries about the U.S. current account and budget deficits continued to erode support for the Greenback. Others said that Washington was allowing the dollar to weaken. The U.S. was also starting to lose its interest rate advantage as other countries begin to scale back easy monetary policy.
Puzzling traders was the dollar’s inability to rally on the back of rapidly rising U.S. interest rates. Treasury yields hit four week highs last week as investors bolstered bets that the Federal Reserve could increase interest rates as many as four times this year.
Daily Swing Chart Analysis
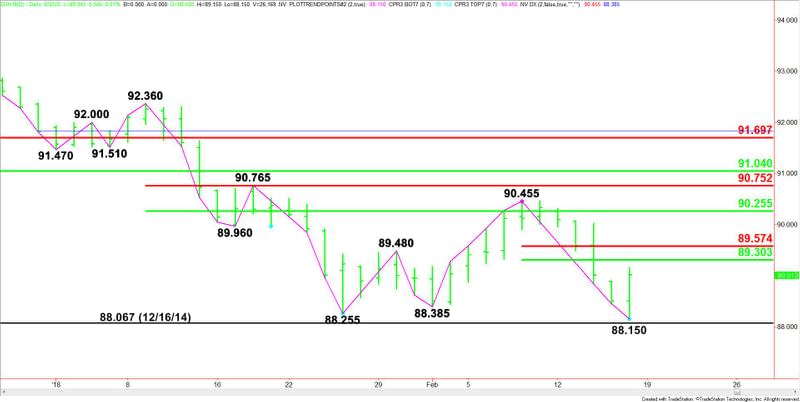
The main trend is down according to the daily swing chart. However, Friday’s closing price reversal bottom may have signaled a shift in short-term momentum to the upside. A trade through 89.15 will confirm the chart pattern. A move through 90.455 will change the main trend to up.
A trade through 88.15 will negate the reversal bottom and signal a resumption of the downtrend. This could lead to a test of the December 16, 2014 main bottom at 88.067. Taking out this level with conviction could trigger an acceleration to the downside since there is no visible support under this price.
The short-term range is 90.455 to 88.15. Its retracement zone at 89.30 to 89.57 is the primary upside target.
The intermediate range is 92.36 to 88.15. Its retracement zone at 90.255 to 90.75 is the next potential upside target.
Daily Swing Chart Forecast
Based on Friday’s chart pattern, the direction of the index on Monday will likely be determined by trader reaction to Friday’s high at 89.15.
Taking out 89.15 will signal the presence of buyers. It will also confirm the closing price reversal bottom. This could trigger the start of a 2 to 3 day rally into 89.30 to 89.57.
Overcoming 89.57 will indicate the buying is getting stronger with the next targets 90.255 and 90.455.
The inability to confirm the reversal bottom with conviction will signal the return of sellers. This move could create the downside momentum needed to take out 88.15 and 88.067.
This article was originally posted on FX Empire
