
 Yahoo Finance
 UnitedHealth Group Inc's Dividend Analysis
Exploring the Sustainability and Growth of Dividends
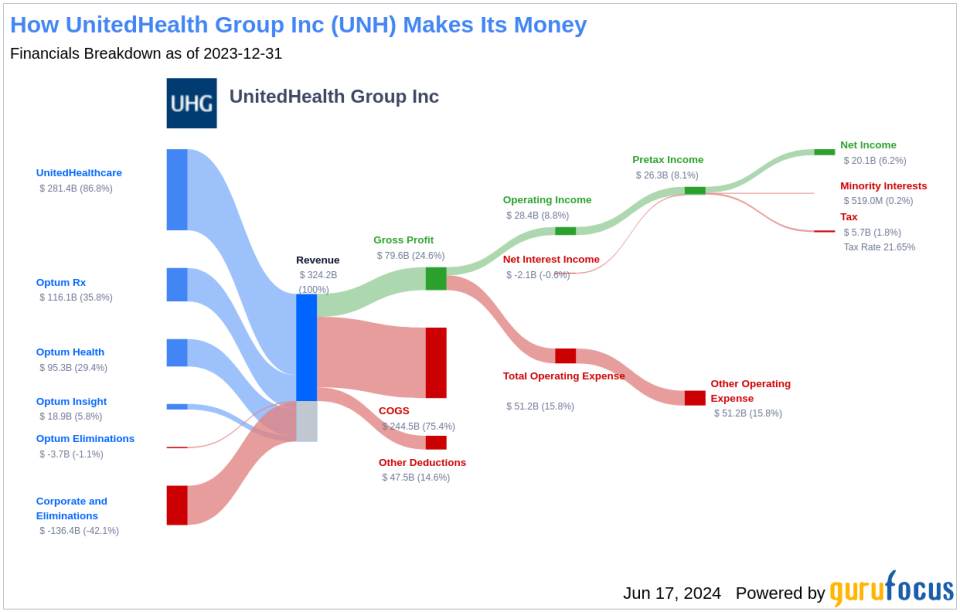
UnitedHealth Group Inc (NYSE:UNH) recently announced a dividend of $2.1 per share, payable on 2024-06-25, with the ex-dividend date set for 2024-06-17. As investors look forward to this upcoming payment, the spotlight also shines on the company's dividend history, yield, and growth rates. Using the data from GuruFocus, let's look into UnitedHealth Group Inc's dividend performance and assess its sustainability.
What Does UnitedHealth Group Inc Do?
This Powerful Chart Made Peter Lynch 29% A Year For 13 Years
How to calculate the intrinsic value of a stock?
UnitedHealth Group is one of the largest private health insurers, providing medical benefits to about 53 million members globally, including 5 million outside the U.S. as of mid-2023. As a leader in employer-sponsored, self-directed, and government-backed insurance plans, UnitedHealth has obtained massive scale in managed care. Along with its insurance assets, UnitedHealth's continued investments in its Optum franchises have created a healthcare services colossus that spans everything from medical and pharmaceutical benefits to providing outpatient care and analytics to both affiliated and third-party customers.
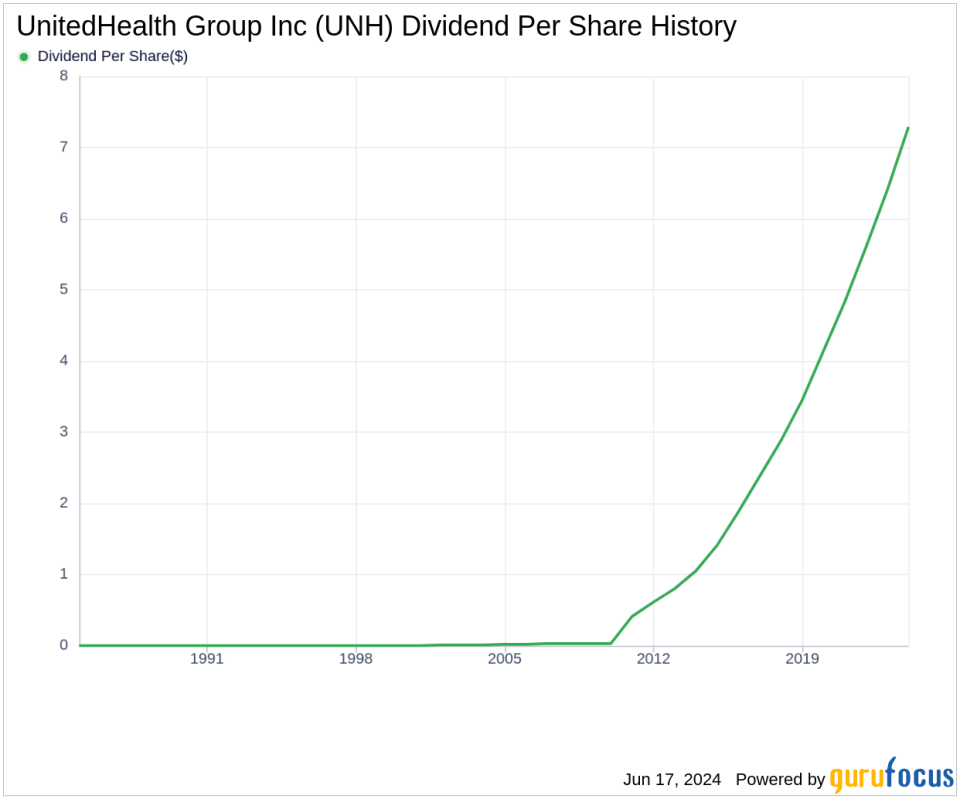
A Glimpse at UnitedHealth Group Inc's Dividend History
UnitedHealth Group Inc has maintained a consistent dividend payment record since 1990. Dividends are currently distributed on a quarterly basis. UnitedHealth Group Inc has increased its dividend each year since 1990. The stock is thus listed as a dividend aristocrat, an honor that is given to companies that have increased their dividend each year for at least the past 34 years. Below is a chart showing annual Dividends Per Share for tracking historical trends.
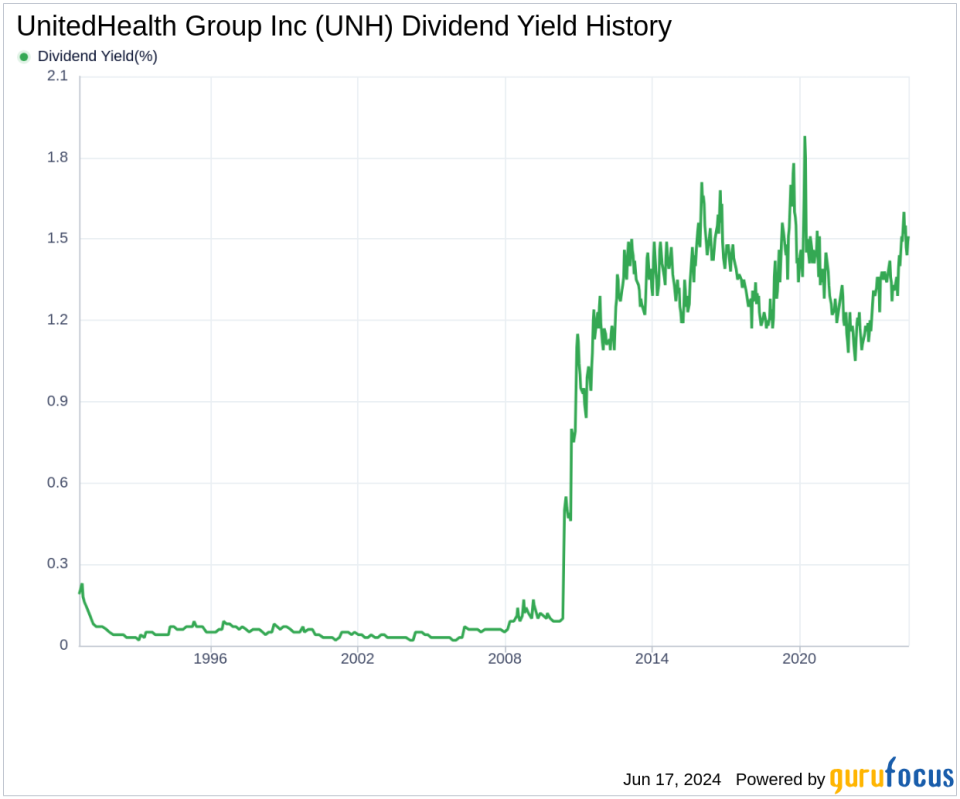
Breaking Down UnitedHealth Group Inc's Dividend Yield and Growth
As of today, UnitedHealth Group Inc currently has a 12-month trailing dividend yield of 1.51% and a 12-month forward dividend yield of 1.69%. This suggests an expectation of increased dividend payments over the next 12 months. Over the past three years, UnitedHealth Group Inc's annual dividend growth rate was 14.70%. Extended to a five-year horizon, this rate increased to 16.00% per year. And over the past decade, UnitedHealth Group Inc's annual dividends per share growth rate stands at an impressive 20.80%.
Based on UnitedHealth Group Inc's dividend yield and five-year growth rate, the 5-year yield on cost of UnitedHealth Group Inc stock as of today is approximately 3.17%.
The Sustainability Question: Payout Ratio and Profitability
To assess the sustainability of the dividend, one needs to evaluate the company's payout ratio. The dividend payout ratio provides insights into the portion of earnings the company distributes as dividends. A lower ratio suggests that the company retains a significant part of its earnings, thereby ensuring the availability of funds for future growth and unexpected downturns. As of 2024-03-31, UnitedHealth Group Inc's dividend payout ratio is 0.29.
UnitedHealth Group Inc's profitability rank, offers an understanding of the company's earnings prowess relative to its peers. GuruFocus ranks UnitedHealth Group Inc's profitability 9 out of 10 as of 2024-03-31, suggesting good profitability prospects. The company has reported positive net income for each year over the past decade, further solidifying its high profitability.
Growth Metrics: The Future Outlook
To ensure the sustainability of dividends, a company must have robust growth metrics. UnitedHealth Group Inc's growth rank of 9 out of 10 suggests that the company's growth trajectory is good relative to its competitors.
Revenue is the lifeblood of any company, and UnitedHealth Group Inc's revenue per share, combined with the 3-year revenue growth rate, indicates a strong revenue model. UnitedHealth Group Inc's revenue has increased by approximately 14.00% per year on average, a rate that outperforms approximately 55% of global competitors.
The company's 3-year EPS growth rate showcases its capability to grow its earnings, a critical component for sustaining dividends in the long run. During the past three years, UnitedHealth Group Inc's earnings increased by approximately 16.20% per year on average, a rate that outperforms approximately 68.42% of global competitors.
Lastly, the company's 5-year EBITDA growth rate of 15.10%, which outperforms approximately 80% of global competitors.
Conclusion: A Robust Dividend Profile
Considering UnitedHealth Group Inc's consistent dividend payments, impressive growth in dividend rates, and a solid payout ratio, the company stands out as a potentially strong candidate for dividend investors. The robust profitability and positive growth metrics further support the sustainability of its dividends. Investors seeking to diversify their portfolios with reliable dividend-paying stocks should consider the promising profile of UnitedHealth Group Inc.
GuruFocus Premium users can screen for high-dividend yield stocks using the High Dividend Yield Screener.
This article, generated by GuruFocus, is designed to provide general insights and is not tailored financial advice. Our commentary is rooted in historical data and analyst projections, utilizing an impartial methodology, and is not intended to serve as specific investment guidance. It does not formulate a recommendation to purchase or divest any stock and does not consider individual investment objectives or financial circumstances. Our objective is to deliver long-term, fundamental data-driven analysis. Be aware that our analysis might not incorporate the most recent, price-sensitive company announcements or qualitative information. GuruFocus holds no position in the stocks mentioned herein.
This article first appeared on GuruFocus.
