
 Yahoo Finance
 We Like These Underlying Return On Capital Trends At TC Energy (TSE:TRP)
To find a multi-bagger stock, what are the underlying trends we should look for in a business? In a perfect world, we'd like to see a company investing more capital into its business and ideally the returns earned from that capital are also increasing. This shows us that it's a compounding machine, able to continually reinvest its earnings back into the business and generate higher returns. So on that note, TC Energy (TSE:TRP) looks quite promising in regards to its trends of return on capital.
Understanding Return On Capital Employed (ROCE)
Just to clarify if you're unsure, ROCE is a metric for evaluating how much pre-tax income (in percentage terms) a company earns on the capital invested in its business. To calculate this metric for TC Energy, this is the formula:
Return on Capital Employed = Earnings Before Interest and Tax (EBIT) ÷ (Total Assets - Current Liabilities)
0.066 = CA$5.8b ÷ (CA$105b - CA$17b) (Based on the trailing twelve months to September 2021).
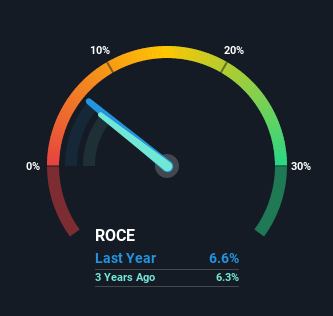
Thus, TC Energy has an ROCE of 6.6%. In absolute terms, that's a low return but it's around the Oil and Gas industry average of 6.3%.
Check out our latest analysis for TC Energy
Above you can see how the current ROCE for TC Energy compares to its prior returns on capital, but there's only so much you can tell from the past. If you'd like, you can check out the forecasts from the analysts covering TC Energy here for free.
The Trend Of ROCE
TC Energy has not disappointed with their ROCE growth. Looking at the data, we can see that even though capital employed in the business has remained relatively flat, the ROCE generated has risen by 41% over the last five years. So our take on this is that the business has increased efficiencies to generate these higher returns, all the while not needing to make any additional investments. On that front, things are looking good so it's worth exploring what management has said about growth plans going forward.
The Bottom Line On TC Energy's ROCE
As discussed above, TC Energy appears to be getting more proficient at generating returns since capital employed has remained flat but earnings (before interest and tax) are up. Investors may not be impressed by the favorable underlying trends yet because over the last five years the stock has only returned 27% to shareholders. So exploring more about this stock could uncover a good opportunity, if the valuation and other metrics stack up.
One more thing: We've identified 6 warning signs with TC Energy (at least 1 which is significant) , and understanding them would certainly be useful.
For those who like to invest in solid companies, check out this free list of companies with solid balance sheets and high returns on equity.
Have feedback on this article? Concerned about the content? Get in touch with us directly. Alternatively, email editorial-team (at) simplywallst.com.
This article by Simply Wall St is general in nature. We provide commentary based on historical data and analyst forecasts only using an unbiased methodology and our articles are not intended to be financial advice. It does not constitute a recommendation to buy or sell any stock, and does not take account of your objectives, or your financial situation. We aim to bring you long-term focused analysis driven by fundamental data. Note that our analysis may not factor in the latest price-sensitive company announcements or qualitative material. Simply Wall St has no position in any stocks mentioned.
