
 Yahoo Finance
 We Like These Underlying Return On Capital Trends At Springfield Properties (LON:SPR)
To find a multi-bagger stock, what are the underlying trends we should look for in a business? Ideally, a business will show two trends; firstly a growing return on capital employed (ROCE) and secondly, an increasing amount of capital employed. If you see this, it typically means it's a company with a great business model and plenty of profitable reinvestment opportunities. Speaking of which, we noticed some great changes in Springfield Properties' (LON:SPR) returns on capital, so let's have a look.
Return On Capital Employed (ROCE): What is it?
If you haven't worked with ROCE before, it measures the 'return' (pre-tax profit) a company generates from capital employed in its business. The formula for this calculation on Springfield Properties is:
Return on Capital Employed = Earnings Before Interest and Tax (EBIT) ÷ (Total Assets - Current Liabilities)
0.16 = UK£20m ÷ (UK£208m - UK£87m) (Based on the trailing twelve months to May 2021).
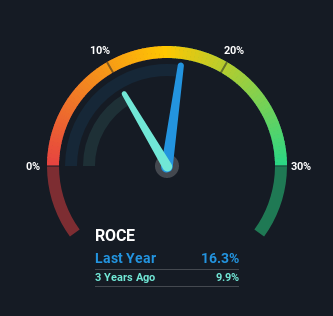
Thus, Springfield Properties has an ROCE of 16%. In absolute terms, that's a satisfactory return, but compared to the Consumer Durables industry average of 10% it's much better.
View our latest analysis for Springfield Properties
Above you can see how the current ROCE for Springfield Properties compares to its prior returns on capital, but there's only so much you can tell from the past. If you'd like, you can check out the forecasts from the analysts covering Springfield Properties here for free.
The Trend Of ROCE
Springfield Properties is displaying some positive trends. The numbers show that in the last five years, the returns generated on capital employed have grown considerably to 16%. The company is effectively making more money per dollar of capital used, and it's worth noting that the amount of capital has increased too, by 109%. This can indicate that there's plenty of opportunities to invest capital internally and at ever higher rates, a combination that's common among multi-baggers.
For the record though, there was a noticeable increase in the company's current liabilities over the period, so we would attribute some of the ROCE growth to that. The current liabilities has increased to 42% of total assets, so the business is now more funded by the likes of its suppliers or short-term creditors. Given it's pretty high ratio, we'd remind investors that having current liabilities at those levels can bring about some risks in certain businesses.
The Bottom Line On Springfield Properties' ROCE
To sum it up, Springfield Properties has proven it can reinvest in the business and generate higher returns on that capital employed, which is terrific. And investors seem to expect more of this going forward, since the stock has rewarded shareholders with a 37% return over the last three years. With that being said, we still think the promising fundamentals mean the company deserves some further due diligence.
Like most companies, Springfield Properties does come with some risks, and we've found 3 warning signs that you should be aware of.
For those who like to invest in solid companies, check out this free list of companies with solid balance sheets and high returns on equity.
This article by Simply Wall St is general in nature. We provide commentary based on historical data and analyst forecasts only using an unbiased methodology and our articles are not intended to be financial advice. It does not constitute a recommendation to buy or sell any stock, and does not take account of your objectives, or your financial situation. We aim to bring you long-term focused analysis driven by fundamental data. Note that our analysis may not factor in the latest price-sensitive company announcements or qualitative material. Simply Wall St has no position in any stocks mentioned.
Have feedback on this article? Concerned about the content? Get in touch with us directly. Alternatively, email editorial-team (at) simplywallst.com.
