
 Yahoo Finance
 We Like These Underlying Return On Capital Trends At Serinus Energy (LON:SENX)
If you're looking for a multi-bagger, there's a few things to keep an eye out for. Firstly, we'll want to see a proven return on capital employed (ROCE) that is increasing, and secondly, an expanding base of capital employed. If you see this, it typically means it's a company with a great business model and plenty of profitable reinvestment opportunities. So when we looked at Serinus Energy (LON:SENX) and its trend of ROCE, we really liked what we saw.
Return On Capital Employed (ROCE): What Is It?
For those that aren't sure what ROCE is, it measures the amount of pre-tax profits a company can generate from the capital employed in its business. The formula for this calculation on Serinus Energy is:
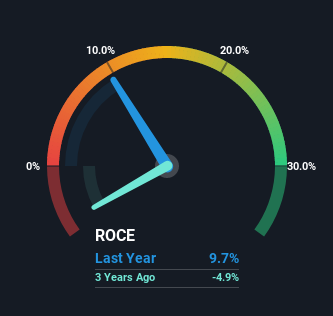
Return on Capital Employed = Earnings Before Interest and Tax (EBIT) ÷ (Total Assets - Current Liabilities)
0.097 = US$7.3m ÷ (US$92m - US$17m) (Based on the trailing twelve months to June 2022).
Therefore, Serinus Energy has an ROCE of 9.7%. In absolute terms, that's a low return, but it's much better than the Oil and Gas industry average of 5.2%.
Check out our latest analysis for Serinus Energy
In the above chart we have measured Serinus Energy's prior ROCE against its prior performance, but the future is arguably more important. If you'd like, you can check out the forecasts from the analysts covering Serinus Energy here for free.
What Does the ROCE Trend For Serinus Energy Tell Us?
Shareholders will be relieved that Serinus Energy has broken into profitability. While the business was unprofitable in the past, it's now turned things around and is earning 9.7% on its capital. While returns have increased, the amount of capital employed by Serinus Energy has remained flat over the period. That being said, while an increase in efficiency is no doubt appealing, it'd be helpful to know if the company does have any investment plans going forward. So if you're looking for high growth, you'll want to see a business's capital employed also increasing.
One more thing to note, Serinus Energy has decreased current liabilities to 18% of total assets over this period, which effectively reduces the amount of funding from suppliers or short-term creditors. Therefore we can rest assured that the growth in ROCE is a result of the business' fundamental improvements, rather than a cooking class featuring this company's books.
In Conclusion...
In summary, we're delighted to see that Serinus Energy has been able to increase efficiencies and earn higher rates of return on the same amount of capital. Although the company may be facing some issues elsewhere since the stock has plunged 85% in the last three years. Regardless, we think the underlying fundamentals warrant this stock for further investigation.
Since virtually every company faces some risks, it's worth knowing what they are, and we've spotted 3 warning signs for Serinus Energy (of which 1 is a bit concerning!) that you should know about.
For those who like to invest in solid companies, check out this free list of companies with solid balance sheets and high returns on equity.
Have feedback on this article? Concerned about the content? Get in touch with us directly. Alternatively, email editorial-team (at) simplywallst.com.
This article by Simply Wall St is general in nature. We provide commentary based on historical data and analyst forecasts only using an unbiased methodology and our articles are not intended to be financial advice. It does not constitute a recommendation to buy or sell any stock, and does not take account of your objectives, or your financial situation. We aim to bring you long-term focused analysis driven by fundamental data. Note that our analysis may not factor in the latest price-sensitive company announcements or qualitative material. Simply Wall St has no position in any stocks mentioned.
Join A Paid User Research Session
You’ll receive a US$30 Amazon Gift card for 1 hour of your time while helping us build better investing tools for the individual investors like yourself. Sign up here
