
 Yahoo Finance
 We Like These Underlying Return On Capital Trends At H2O Innovation (CVE:HEO)
If we want to find a stock that could multiply over the long term, what are the underlying trends we should look for? In a perfect world, we'd like to see a company investing more capital into its business and ideally the returns earned from that capital are also increasing. If you see this, it typically means it's a company with a great business model and plenty of profitable reinvestment opportunities. Speaking of which, we noticed some great changes in H2O Innovation's (CVE:HEO) returns on capital, so let's have a look.
What is Return On Capital Employed (ROCE)?
For those who don't know, ROCE is a measure of a company's yearly pre-tax profit (its return), relative to the capital employed in the business. The formula for this calculation on H2O Innovation is:
Return on Capital Employed = Earnings Before Interest and Tax (EBIT) ÷ (Total Assets - Current Liabilities)
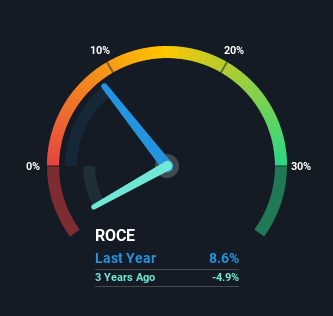
0.086 = CA$8.8m ÷ (CA$134m - CA$32m) (Based on the trailing twelve months to March 2021).
Therefore, H2O Innovation has an ROCE of 8.6%. On its own that's a low return on capital but it's in line with the industry's average returns of 8.6%.
View our latest analysis for H2O Innovation
In the above chart we have measured H2O Innovation's prior ROCE against its prior performance, but the future is arguably more important. If you'd like, you can check out the forecasts from the analysts covering H2O Innovation here for free.
What Does the ROCE Trend For H2O Innovation Tell Us?
We're glad to see that ROCE is heading in the right direction, even if it is still low at the moment. The data shows that returns on capital have increased substantially over the last five years to 8.6%. Basically the business is earning more per dollar of capital invested and in addition to that, 239% more capital is being employed now too. This can indicate that there's plenty of opportunities to invest capital internally and at ever higher rates, a combination that's common among multi-baggers.
One more thing to note, H2O Innovation has decreased current liabilities to 24% of total assets over this period, which effectively reduces the amount of funding from suppliers or short-term creditors. So this improvement in ROCE has come from the business' underlying economics, which is great to see.
What We Can Learn From H2O Innovation's ROCE
To sum it up, H2O Innovation has proven it can reinvest in the business and generate higher returns on that capital employed, which is terrific. And with a respectable 64% awarded to those who held the stock over the last five years, you could argue that these developments are starting to get the attention they deserve. With that being said, we still think the promising fundamentals mean the company deserves some further due diligence.
One more thing to note, we've identified 1 warning sign with H2O Innovation and understanding it should be part of your investment process.
If you want to search for solid companies with great earnings, check out this free list of companies with good balance sheets and impressive returns on equity.
This article by Simply Wall St is general in nature. We provide commentary based on historical data and analyst forecasts only using an unbiased methodology and our articles are not intended to be financial advice. It does not constitute a recommendation to buy or sell any stock, and does not take account of your objectives, or your financial situation. We aim to bring you long-term focused analysis driven by fundamental data. Note that our analysis may not factor in the latest price-sensitive company announcements or qualitative material. Simply Wall St has no position in any stocks mentioned.
Have feedback on this article? Concerned about the content? Get in touch with us directly. Alternatively, email editorial-team (at) simplywallst.com.
