
 Yahoo Finance
 Under The Bonnet, Temple & Webster Group's (ASX:TPW) Returns Look Impressive
If you're not sure where to start when looking for the next multi-bagger, there are a few key trends you should keep an eye out for. One common approach is to try and find a company with returns on capital employed (ROCE) that are increasing, in conjunction with a growing amount of capital employed. This shows us that it's a compounding machine, able to continually reinvest its earnings back into the business and generate higher returns. So when we looked at the ROCE trend of Temple & Webster Group (ASX:TPW) we really liked what we saw.
Return On Capital Employed (ROCE): What is it?
Just to clarify if you're unsure, ROCE is a metric for evaluating how much pre-tax income (in percentage terms) a company earns on the capital invested in its business. Analysts use this formula to calculate it for Temple & Webster Group:
Return on Capital Employed = Earnings Before Interest and Tax (EBIT) ÷ (Total Assets - Current Liabilities)
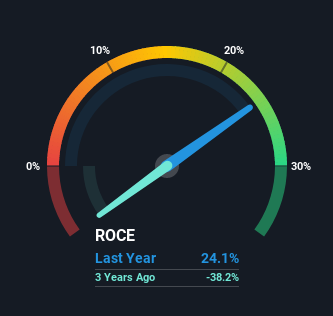
0.24 = AU$20m ÷ (AU$129m - AU$46m) (Based on the trailing twelve months to December 2020).
Thus, Temple & Webster Group has an ROCE of 24%. In absolute terms that's a very respectable return and compared to the Online Retail industry average of 27% it's pretty much on par.
Check out our latest analysis for Temple & Webster Group
In the above chart we have measured Temple & Webster Group's prior ROCE against its prior performance, but the future is arguably more important. If you'd like to see what analysts are forecasting going forward, you should check out our free report for Temple & Webster Group.
What The Trend Of ROCE Can Tell Us
We're delighted to see that Temple & Webster Group is reaping rewards from its investments and is now generating some pre-tax profits. About five years ago the company was generating losses but things have turned around because it's now earning 24% on its capital. And unsurprisingly, like most companies trying to break into the black, Temple & Webster Group is utilizing 91% more capital than it was five years ago. This can tell us that the company has plenty of reinvestment opportunities that are able to generate higher returns.
The Bottom Line
Long story short, we're delighted to see that Temple & Webster Group's reinvestment activities have paid off and the company is now profitable. And a remarkable 6,700% total return over the last five years tells us that investors are expecting more good things to come in the future. Therefore, we think it would be worth your time to check if these trends are going to continue.
If you'd like to know about the risks facing Temple & Webster Group, we've discovered 1 warning sign that you should be aware of.
Temple & Webster Group is not the only stock earning high returns. If you'd like to see more, check out our free list of companies earning high returns on equity with solid fundamentals.
This article by Simply Wall St is general in nature. It does not constitute a recommendation to buy or sell any stock, and does not take account of your objectives, or your financial situation. We aim to bring you long-term focused analysis driven by fundamental data. Note that our analysis may not factor in the latest price-sensitive company announcements or qualitative material. Simply Wall St has no position in any stocks mentioned.
Have feedback on this article? Concerned about the content? Get in touch with us directly. Alternatively, email editorial-team (at) simplywallst.com.
