U.S. Dollar Index Futures (DX) Technical Analysis – Strengthens Over 97.545, Weakens Under 97.510
The U.S. Dollar plummeted against a basket of major currencies on Friday. Some of the move was fueled by aggressive safe-haven buying, which drove the Japanese Yen and Swiss Franc sharply higher. Most of the move was likely fueled by the notion that the U.S. was moving closer to recession.
On Friday, September U.S. Dollar Index futures settled at 97.530, down 0.534 or -0.54%.
The catalysts behind the weakness were dovish comments from Federal Reserve Chairman Jerome Powell and President Trump’s urging of American companies to end business with China, which signaled an escalation of the trade war between the two economic powerhouses.

Daily Swing Chart Technical Analysis
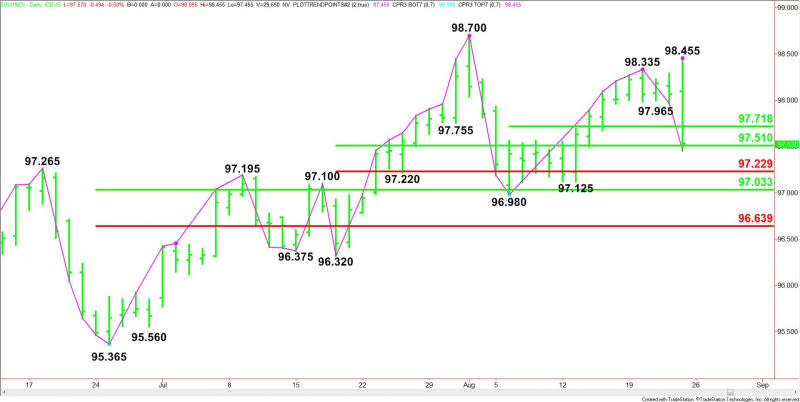
The main trend is up according to the daily swing chart, however, momentum shifted to the downside with the formation of the closing price reversal top from Friday at 98.455.
A trade through 98.455 will negate the closing price reversal top and signal a resumption of the uptrend. A move through 96.980 will change the main trend to down.
The minor trend is down. It changed to down on a trade through 97.965 on Friday. This move also signaled a shift in momentum to the downside.
The short-term range is 96.980 to 98.455. Its retracement zone at 97.720 to 97.545 is the first downside target.
The intermediate range is 96.320 to 98.700. Its retracement zone at 97.510 to 97.230 is the second downside target.
Combining the short-term and intermediate ranges creates a support cluster at 97.545 to 97.510 stopped the selling on Friday. This area should determine the near-term direction of the index.
The main range is 95.365 to 98.700. Its retracement zone at 97.035 to 96.640 is controlling the longer-term direction of the index.
Daily Swing Chart Technical Forecast
Based on Friday’s price action and the close at 97.530, the direction of the September U.S. Dollar Index on Monday is likely to be determined by trader reaction to the support cluster at 97.545 to 97.510.
Bearish Scenario
A sustained move under 97.510 will indicate the presence of sellers. If this creates enough downside momentum then look for the selling to possibly extend into the intermediate Fibonacci level at 97.230. We could see a technical bounce on the first test of this level. If it fails then look for the selling to possibly extend into the main 50% level at 97.035 and the main bottom at 96.980.
The next potential trigger point for an acceleration to the downside is the main bottom at 96.980. Taking out this bottom will change the main trend to down and could trigger a massive amount of sell-stops.
Bullish Scenario
A sustain move over 97.545 will signal that buyers are returning to defend the uptrend. Overcoming the first target at 97.720 could create the upside momentum needed to challenge Friday’s high at 98.455.
Overview
As we’ve said numerous times, the first break after a prolonged rally is usually long liquidation. The real shorting comes after a secondary lower top. If we don’t get much of a follow-through to the downside on Monday then we could see a snap back to the upside, which could put the index in a position to form the secondary lower top.
This article was originally posted on FX Empire
More From FXEMPIRE:
NZD/USD Forex Technical Analysis – Strengthens Over .6411, Weakens Under .6362
Oil Price Fundamental Weekly Forecast – Expect Lower Demand Growth as US-China Trade War Escalates
RBA’s Philip Lowe: ‘Political Shocks are Turning into Economic Shocks’
Bitcoin Sees More Red as the Broader Market Takes another Weekly Hit
U.S. Dollar Index Futures (DX) Technical Analysis – Strengthens Over 97.545, Weakens Under 97.510
Bitcoin Cash – ABC, Litecoin and Ripple Daily Analysis – 24/08/19

 Yahoo Finance