
 Yahoo Finance
 U.S. Bancorp (USB) Q3 Earnings Top Estimates on High Revenues
Driven by top-line strength, U.S. Bancorp USB recorded a positive earnings surprise of 3.6% in third-quarter 2019. Earnings per share of $1.15 surpassed the Zacks Consensus Estimate of $1.11. Also, the reported figure is up 8.5% from the prior-year quarter.
Higher interest and fee income were the driving factors. Further, loan and deposit growth was recorded. However, escalating expenses and provisions were the undermining factors.
Net income came in at $1.92 billion compared with the $1.82 billion reported in the prior-year quarter.
Revenues & Loans Grow, Costs & Provisions Flare Up
U.S. Bancorp’s net revenues came in at around $5.9 billion in the third quarter, up 3.9% year over year. Increase in net interest as well as non-interest income led to this upside. The top-line figure also outpaced the Zacks Consensus Estimate of $5.8 billion.
U.S. Bancorp’s tax-equivalent net interest income totaled $3.3 billion in the reported quarter, up 0.8% from the prior-year quarter. This upswing mainly stemmed from earning assets growth and increased yields on securities. These positives were partially mitigated by a flatter yield curve, deposit pricing and shift in funding mix, along with lower rates.
Average earning assets were up 4.9% year over year, supported by growth in average total loans, average investment securities and average other earning assets. Furthermore, net interest margin of 3.02% shrunk 13 basis points year on year.
U.S. Bancorp’s non-interest income escalated around 8.1% on a year-over-year basis to $2.6 billion. This upside can be attributed to rise in almost all components of income, partly muted by lower deposit service charges, treasury management fees and investment products fees.
Provision for credit losses increased 7% year over year to $367 million in the September-end quarter.
U.S. Bancorp’s average total loans inched up 1.1% sequentially to $292.4 billion. This stemmed from a rise in commercial loans, residential mortgages, credit card and other retail loans.
Average total deposits were up 1.4% from the previous quarter to $349.9 billion. This upside resulted from growth in interest as well as non-interest-bearing deposits.
Non-interest expenses flared up 3.3% year over year to $3.1 billion at U.S. Bancorp. This upsurge in mostly all components of non-interest expenses, however, was partially mitigated by lower other expenses.
Efficiency ratio came in at 53.3%, improving from the year-ago quarter’s 53.5%. A decrease in the ratio indicates improved profitability.
Credit Quality: A Mixed Bag
Credit metrics at U.S. Bancorp remained mixed in the July-September quarter. Net charge-offs came in at $352 million, up 7.3% year over year. On a year-over-year basis, the company witnessed deterioration, mainly in net charge-offs in the credit card, other retail, commercial and commercial real estate portfolios.
U.S. Bancorp’s non-performing assets (excluding covered assets) came in at $979 million, down 2.5% year over year. Total allowance for credit losses was $4.5 billion, up 2.3% year over year.
Strong Capital Position
During the third quarter, U.S. Bancorp maintained a solid capital position. The Tier 1 capital ratio came in at 11.2% compared with the prior-year quarter’s 10.6%. Common equity Tier 1 capital to risk-weighted assets ratio under the Basel III standardized approach fully implemented was 13.2% as of Sep 30, 2019, up from 12.6% reported at the end of the year-ago quarter.
All regulatory ratios of U.S. Bancorp continued to be in excess of well-capitalized requirements. In addition, based on the Basel III fully implemented advanced approach, the Tier 1 common equity to risk-weighted assets ratio was estimated at 12.6%, as of Sep 30, 2019, compared with 11.8% witnessed at the end of the year-ago quarter.
The tangible common equity to tangible assets ratio was 8% as of Sep 30, 2019, up from the prior year’s 7.7%.
U.S. Bancorp posted an improvement in book value per share, which increased to $30.26 as of Sep 30, 2019, from $27.35 recorded at the end of the year-earlier quarter.
Capital Deployment Update
Reflecting the company’s capital strength during the third quarter, U.S. Bancorp returned 80% of earnings to its shareholders through common stock dividends and buybacks.
Conclusion
U.S. Bancorp put up an impressive show during the July-September quarter. Growth in revenues, aided by increase in lending activities and fee income, is anticipated to continue. Nonetheless, weakness in the credit card portfolio and escalating expenses remain headwinds. This apart, slowdown in growth in net interest margin is another concern.
U.S. Bancorp Price, Consensus and EPS Surprise
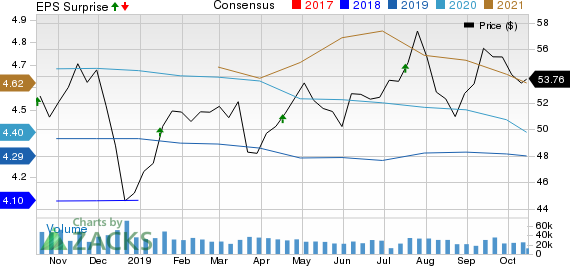
U.S. Bancorp price-consensus-eps-surprise-chart | U.S. Bancorp Quote
U.S. Bancorp currently carries a Zacks Rank #3 (Hold). You can see the complete list of today’s Zacks #1 Rank (Strong Buy) stocks here.
Performance of Other Major Banks
Goldman Sachs’ GS third-quarter 2019 results posted a negative earnings surprise of 4.8%. The company reported earnings per share of $4.79, missing the Zacks Consensus Estimate of $5.03. Further, the bottom-line figure compares unfavorably with earnings of $6.28 per share recorded in the year-earlier quarter.
Wells Fargo’s WFC third-quarter earnings of 92 cents per share lagged the Zacks Consensus Estimate of $1.15 on lower net interest income. The figure also comes in lower than the prior-year quarter earnings of $1.13 per share. Results include discrete litigation accrual (not tax-deductible) worth 35 cents per share, and gain from the sale of Institutional Retirement and Trust (IRT) business worth 20 cents. Also, the partial redemption of Series K Preferred Stock decreased earnings by 5 cents.
Citigroup C delivered a positive earnings surprise of 1% in the third quarter, backed by improved investment banking performance. Adjusted earnings per share of $1.98 outpaced the Zacks Consensus Estimate of $1.96. Also, earnings climbed 20% year over year.
Free: Zacks’ Single Best Stock Set to Double
Today you are invited to download our just-released Special Report that reveals 5 stocks with the most potential to gain +100% or more in 2020. From those 5, Zacks Director of Research, Sheraz Mian hand-picks one to have the most explosive upside of all.
This pioneering tech ticker had soared to all-time highs and then subsided to a price that is irresistible. Now a pending acquisition could super-charge the company’s drive past competitors in the development of true Artificial Intelligence. The earlier you get in to this stock, the greater your potential gain.
Download Free Report Now >>
Want the latest recommendations from Zacks Investment Research? Today, you can download 7 Best Stocks for the Next 30 Days. Click to get this free report
U.S. Bancorp (USB) : Free Stock Analysis Report
Citigroup Inc. (C) : Free Stock Analysis Report
Wells Fargo & Company (WFC) : Free Stock Analysis Report
The Goldman Sachs Group, Inc. (GS) : Free Stock Analysis Report
To read this article on Zacks.com click here.
Zacks Investment Research
