
 Yahoo Finance
 What Type Of Shareholder Owns Data#3 Limited's (ASX:DTL)?

Want to participate in a short research study? Help shape the future of investing tools and you could win a $250 gift card!
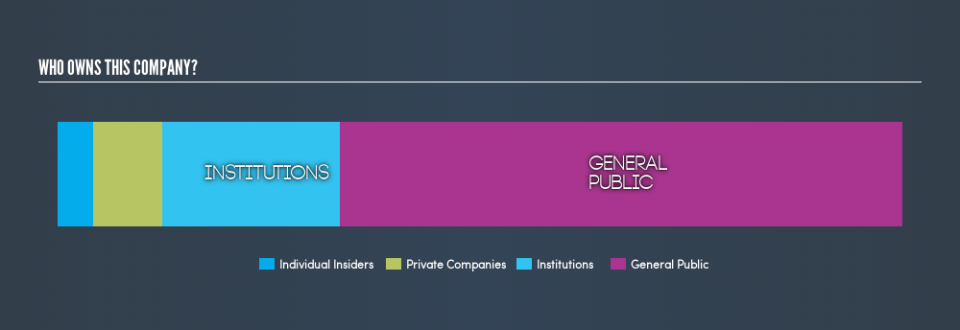
A look at the shareholders of Data#3 Limited (ASX:DTL) can tell us which group is most powerful. Insiders often own a large chunk of younger, smaller, companies while huge companies tend to have institutions as shareholders. Companies that have been privatized tend to have low insider ownership.
Data#3 is a smaller company with a market capitalization of AU$273m, so it may still be flying under the radar of many institutional investors. Taking a look at our data on the ownership groups (below), it's seems that institutions own shares in the company. Let's take a closer look to see what the different types of shareholder can tell us about DTL.
See our latest analysis for Data#3
What Does The Institutional Ownership Tell Us About Data#3?
Institutional investors commonly compare their own returns to the returns of a commonly followed index. So they generally do consider buying larger companies that are included in the relevant benchmark index.
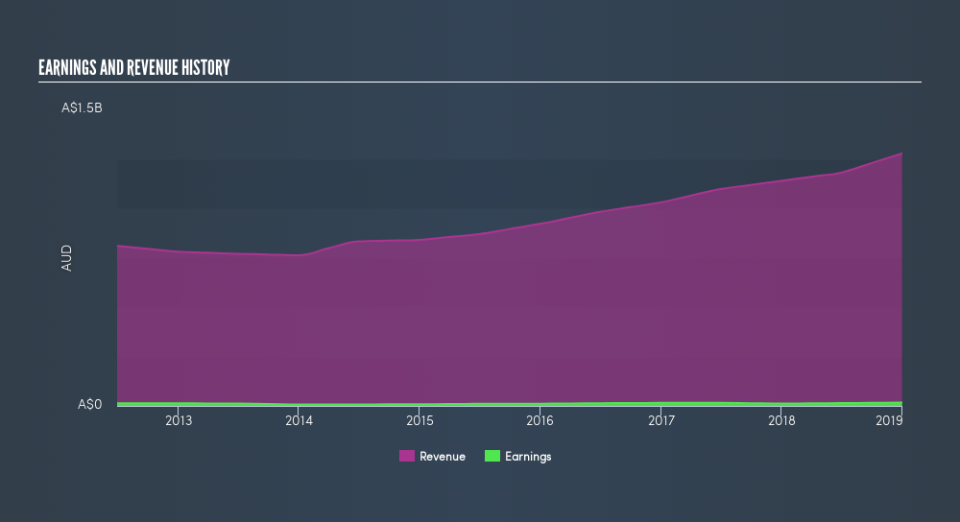
Data#3 already has institutions on the share registry. Indeed, they own 21% of the company. This can indicate that the company has a certain degree of credibility in the investment community. However, it is best to be wary of relying on the supposed validation that comes with institutional investors. They too, get it wrong sometimes. It is not uncommon to see a big share price drop if two large institutional investors try to sell out of a stock at the same time. So it is worth checking the past earnings trajectory of Data#3, (below). Of course, keep in mind that there are other factors to consider, too.
Hedge funds don't have many shares in Data#3. There is a little analyst coverage of the stock, but not much. So there is room for it to gain more coverage.
Insider Ownership Of Data#3
While the precise definition of an insider can be subjective, almost everyone considers board members to be insiders. Company management run the business, but the CEO will answer to the board, even if he or she is a member of it.
Most consider insider ownership a positive because it can indicate the board is well aligned with other shareholders. However, on some occasions too much power is concentrated within this group.
I can report that insiders do own shares in Data#3 Limited. As individuals, the insiders collectively own AU$12m worth of the AU$273m company. This shows at least some alignment, but I usually like to see larger insider holdings. You can click here to see if those insiders have been buying or selling.
General Public Ownership
The general public -- mostly retail investors -- own 67% of Data#3 . This size of ownership gives retail investors collective power. They can and probably do influence decisions on executive compensation, dividend policies and proposed business acquisitions.
Private Company Ownership
Our data indicates that Private Companies hold 8.1%, of the company's shares. Private companies may be related parties. Sometimes insiders have an interest in a public company through a holding in a private company, rather than in their own capacity as an individual. While it's hard to draw any broad stroke conclusions, it is worth noting as an area for further research.
Next Steps:
I find it very interesting to look at who exactly owns a company. But to truly gain insight, we need to consider other information, too.
I like to dive deeper into how a company has performed in the past. You can access this interactive graph of past earnings, revenue and cash flow, for free .
But ultimately it is the future, not the past, that will determine how well the owners of this business will do. Therefore we think it advisable to take a look at this free report showing whether analysts are predicting a brighter future.
NB: Figures in this article are calculated using data from the last twelve months, which refer to the 12-month period ending on the last date of the month the financial statement is dated. This may not be consistent with full year annual report figures.
We aim to bring you long-term focused research analysis driven by fundamental data. Note that our analysis may not factor in the latest price-sensitive company announcements or qualitative material.
If you spot an error that warrants correction, please contact the editor at editorial-team@simplywallst.com. This article by Simply Wall St is general in nature. It does not constitute a recommendation to buy or sell any stock, and does not take account of your objectives, or your financial situation. Simply Wall St has no position in the stocks mentioned. Thank you for reading.
