
 Yahoo Finance
 What Type Of Returns Would Jones Lang LaSalle's(NYSE:JLL) Shareholders Have Earned If They Purchased Their SharesFive Years Ago?

In order to justify the effort of selecting individual stocks, it's worth striving to beat the returns from a market index fund. But in any portfolio, there will be mixed results between individual stocks. At this point some shareholders may be questioning their investment in Jones Lang LaSalle Incorporated (NYSE:JLL), since the last five years saw the share price fall 28%. And we doubt long term believers are the only worried holders, since the stock price has declined 24% over the last twelve months. The silver lining is that the stock is up 1.6% in about a week.
View our latest analysis for Jones Lang LaSalle
To paraphrase Benjamin Graham: Over the short term the market is a voting machine, but over the long term it's a weighing machine. One flawed but reasonable way to assess how sentiment around a company has changed is to compare the earnings per share (EPS) with the share price.
During the five years over which the share price declined, Jones Lang LaSalle's earnings per share (EPS) dropped by 3.1% each year. Readers should note that the share price has fallen faster than the EPS, at a rate of 6% per year, over the period. So it seems the market was too confident about the business, in the past.
You can see how EPS has changed over time in the image below (click on the chart to see the exact values).
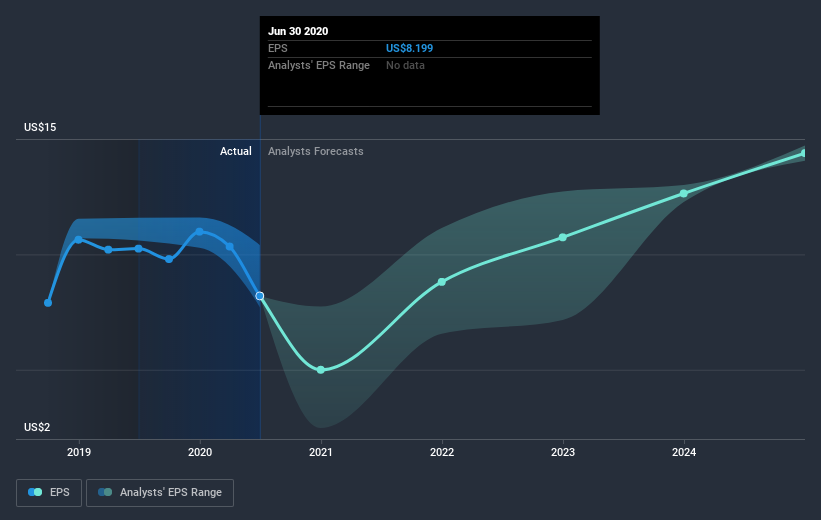
Dive deeper into Jones Lang LaSalle's key metrics by checking this interactive graph of Jones Lang LaSalle's earnings, revenue and cash flow.
A Different Perspective
Investors in Jones Lang LaSalle had a tough year, with a total loss of 24%, against a market gain of about 21%. However, keep in mind that even the best stocks will sometimes underperform the market over a twelve month period. Unfortunately, last year's performance may indicate unresolved challenges, given that it was worse than the annualised loss of 5% over the last half decade. Generally speaking long term share price weakness can be a bad sign, though contrarian investors might want to research the stock in hope of a turnaround. It's always interesting to track share price performance over the longer term. But to understand Jones Lang LaSalle better, we need to consider many other factors. Even so, be aware that Jones Lang LaSalle is showing 2 warning signs in our investment analysis , you should know about...
If you like to buy stocks alongside management, then you might just love this free list of companies. (Hint: insiders have been buying them).
Please note, the market returns quoted in this article reflect the market weighted average returns of stocks that currently trade on US exchanges.
This article by Simply Wall St is general in nature. It does not constitute a recommendation to buy or sell any stock, and does not take account of your objectives, or your financial situation. We aim to bring you long-term focused analysis driven by fundamental data. Note that our analysis may not factor in the latest price-sensitive company announcements or qualitative material. Simply Wall St has no position in any stocks mentioned.
Have feedback on this article? Concerned about the content? Get in touch with us directly. Alternatively, email editorial-team@simplywallst.com.
