
 Yahoo Finance
 TTM Technologies (NASDAQ:TTMI) shareholders have earned a 7.5% CAGR over the last three years
Low-cost index funds make it easy to achieve average market returns. But in any diversified portfolio of stocks, you'll see some that fall short of the average. Unfortunately for shareholders, while the TTM Technologies, Inc. (NASDAQ:TTMI) share price is up 24% in the last three years, that falls short of the market return. In the last year the stock has gained 14%.
Let's take a look at the underlying fundamentals over the longer term, and see if they've been consistent with shareholders returns.
See our latest analysis for TTM Technologies
To paraphrase Benjamin Graham: Over the short term the market is a voting machine, but over the long term it's a weighing machine. One way to examine how market sentiment has changed over time is to look at the interaction between a company's share price and its earnings per share (EPS).
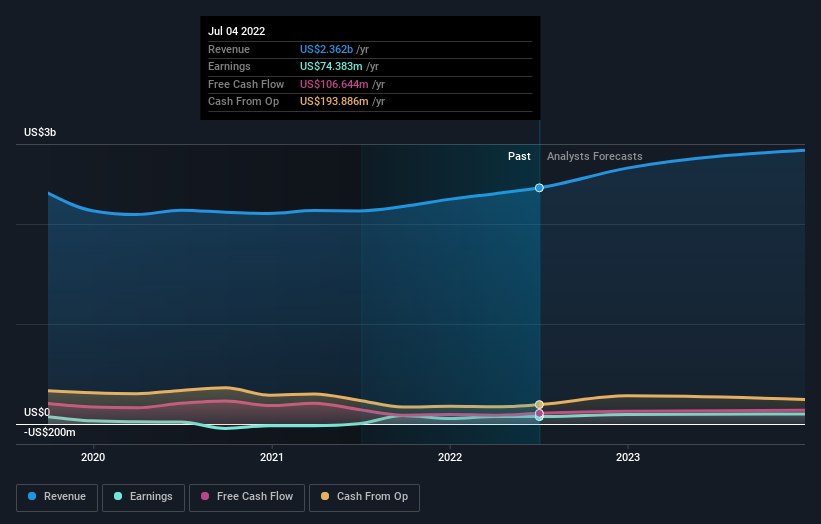
During the three years of share price growth, TTM Technologies actually saw its earnings per share (EPS) drop 8.2% per year.
This means it's unlikely the market is judging the company based on earnings growth. Given this situation, it makes sense to look at other metrics too.
You can only imagine how long term shareholders feel about the declining revenue trend (slipping at 0.3% per year). The only thing that's clear is there is low correlation between TTM Technologies' share price and its historic fundamental data. Further research may be required!
The graphic below depicts how earnings and revenue have changed over time (unveil the exact values by clicking on the image).
It's probably worth noting that the CEO is paid less than the median at similar sized companies. It's always worth keeping an eye on CEO pay, but a more important question is whether the company will grow earnings throughout the years. This free report showing analyst forecasts should help you form a view on TTM Technologies
A Different Perspective
It's nice to see that TTM Technologies shareholders have received a total shareholder return of 14% over the last year. That's better than the annualised return of 0.8% over half a decade, implying that the company is doing better recently. Given the share price momentum remains strong, it might be worth taking a closer look at the stock, lest you miss an opportunity. I find it very interesting to look at share price over the long term as a proxy for business performance. But to truly gain insight, we need to consider other information, too. Consider for instance, the ever-present spectre of investment risk. We've identified 2 warning signs with TTM Technologies (at least 1 which is a bit concerning) , and understanding them should be part of your investment process.
We will like TTM Technologies better if we see some big insider buys. While we wait, check out this free list of growing companies with considerable, recent, insider buying.
Please note, the market returns quoted in this article reflect the market weighted average returns of stocks that currently trade on US exchanges.
Have feedback on this article? Concerned about the content? Get in touch with us directly. Alternatively, email editorial-team (at) simplywallst.com.
This article by Simply Wall St is general in nature. We provide commentary based on historical data and analyst forecasts only using an unbiased methodology and our articles are not intended to be financial advice. It does not constitute a recommendation to buy or sell any stock, and does not take account of your objectives, or your financial situation. We aim to bring you long-term focused analysis driven by fundamental data. Note that our analysis may not factor in the latest price-sensitive company announcements or qualitative material. Simply Wall St has no position in any stocks mentioned.
Join A Paid User Research Session
You’ll receive a US$30 Amazon Gift card for 1 hour of your time while helping us build better investing tools for the individual investors like yourself. Sign up here
