
 Yahoo Finance
 Trustmark (NASDAQ:TRMK) shareholders have earned a 25% return over the last year
We believe investing is smart because history shows that stock markets go higher in the long term. But not every stock you buy will perform as well as the overall market. Unfortunately for shareholders, while the Trustmark Corporation (NASDAQ:TRMK) share price is up 20% in the last year, that falls short of the market return. In contrast, the longer term returns are negative, since the share price is 14% lower than it was three years ago.
Now it's worth having a look at the company's fundamentals too, because that will help us determine if the long term shareholder return has matched the performance of the underlying business.
See our latest analysis for Trustmark
While markets are a powerful pricing mechanism, share prices reflect investor sentiment, not just underlying business performance. One imperfect but simple way to consider how the market perception of a company has shifted is to compare the change in the earnings per share (EPS) with the share price movement.
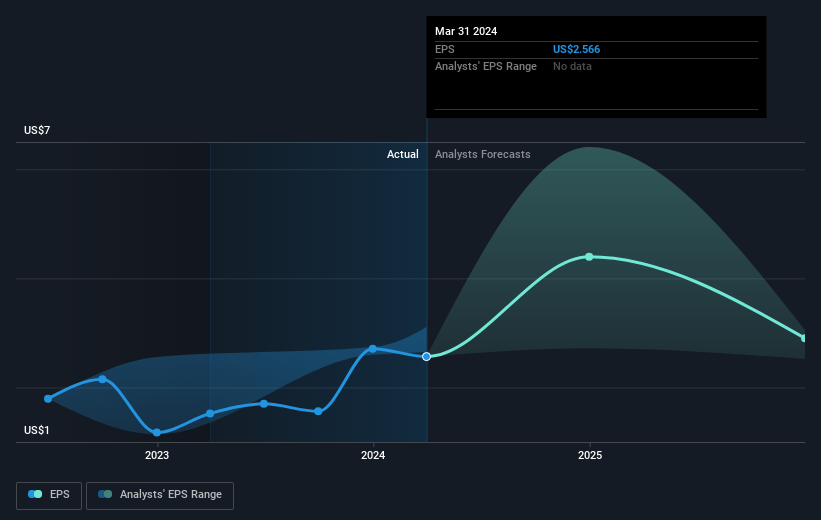
During the last year Trustmark grew its earnings per share (EPS) by 69%. This EPS growth is significantly higher than the 20% increase in the share price. So it seems like the market has cooled on Trustmark, despite the growth. Interesting. The caution is also evident in the lowish P/E ratio of 11.05.
You can see below how EPS has changed over time (discover the exact values by clicking on the image).
It's probably worth noting that the CEO is paid less than the median at similar sized companies. But while CEO remuneration is always worth checking, the really important question is whether the company can grow earnings going forward. Dive deeper into the earnings by checking this interactive graph of Trustmark's earnings, revenue and cash flow.
What About Dividends?
As well as measuring the share price return, investors should also consider the total shareholder return (TSR). The TSR is a return calculation that accounts for the value of cash dividends (assuming that any dividend received was reinvested) and the calculated value of any discounted capital raisings and spin-offs. Arguably, the TSR gives a more comprehensive picture of the return generated by a stock. We note that for Trustmark the TSR over the last 1 year was 25%, which is better than the share price return mentioned above. And there's no prize for guessing that the dividend payments largely explain the divergence!
A Different Perspective
Trustmark's TSR for the year was broadly in line with the market average, at 25%. That gain looks pretty satisfying, and it is even better than the five-year TSR of 0.5% per year. Even if the share price growth slows down from here, there's a good chance that this is business worth watching in the long term. If you would like to research Trustmark in more detail then you might want to take a look at whether insiders have been buying or selling shares in the company.
If you like to buy stocks alongside management, then you might just love this free list of companies. (Hint: many of them are unnoticed AND have attractive valuation).
Please note, the market returns quoted in this article reflect the market weighted average returns of stocks that currently trade on American exchanges.
Have feedback on this article? Concerned about the content? Get in touch with us directly. Alternatively, email editorial-team (at) simplywallst.com.
This article by Simply Wall St is general in nature. We provide commentary based on historical data and analyst forecasts only using an unbiased methodology and our articles are not intended to be financial advice. It does not constitute a recommendation to buy or sell any stock, and does not take account of your objectives, or your financial situation. We aim to bring you long-term focused analysis driven by fundamental data. Note that our analysis may not factor in the latest price-sensitive company announcements or qualitative material. Simply Wall St has no position in any stocks mentioned.
