
 Yahoo Finance
 Trinity Exploration & Production (LON:TRIN) Is Looking To Continue Growing Its Returns On Capital
There are a few key trends to look for if we want to identify the next multi-bagger. One common approach is to try and find a company with returns on capital employed (ROCE) that are increasing, in conjunction with a growing amount of capital employed. Put simply, these types of businesses are compounding machines, meaning they are continually reinvesting their earnings at ever-higher rates of return. Speaking of which, we noticed some great changes in Trinity Exploration & Production's (LON:TRIN) returns on capital, so let's have a look.
Understanding Return On Capital Employed (ROCE)
For those that aren't sure what ROCE is, it measures the amount of pre-tax profits a company can generate from the capital employed in its business. Analysts use this formula to calculate it for Trinity Exploration & Production:
Return on Capital Employed = Earnings Before Interest and Tax (EBIT) ÷ (Total Assets - Current Liabilities)
0.045 = US$5.1m ÷ (US$127m - US$15m) (Based on the trailing twelve months to June 2023).
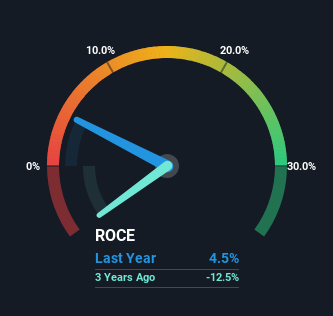
Thus, Trinity Exploration & Production has an ROCE of 4.5%. Ultimately, that's a low return and it under-performs the Oil and Gas industry average of 13%.
View our latest analysis for Trinity Exploration & Production
In the above chart we have measured Trinity Exploration & Production's prior ROCE against its prior performance, but the future is arguably more important. If you're interested, you can view the analysts predictions in our free analyst report for Trinity Exploration & Production .
What Does the ROCE Trend For Trinity Exploration & Production Tell Us?
Trinity Exploration & Production has broken into the black (profitability) and we're sure it's a sight for sore eyes. The company now earns 4.5% on its capital, because five years ago it was incurring losses. On top of that, what's interesting is that the amount of capital being employed has remained steady, so the business hasn't needed to put any additional money to work to generate these higher returns. So while we're happy that the business is more efficient, just keep in mind that could mean that going forward the business is lacking areas to invest internally for growth. So if you're looking for high growth, you'll want to see a business's capital employed also increasing.
In Conclusion...
In summary, we're delighted to see that Trinity Exploration & Production has been able to increase efficiencies and earn higher rates of return on the same amount of capital. Astute investors may have an opportunity here because the stock has declined 65% in the last five years. That being the case, research into the company's current valuation metrics and future prospects seems fitting.
One more thing, we've spotted 3 warning signs facing Trinity Exploration & Production that you might find interesting.
If you want to search for solid companies with great earnings, check out this free list of companies with good balance sheets and impressive returns on equity.
Have feedback on this article? Concerned about the content? Get in touch with us directly. Alternatively, email editorial-team (at) simplywallst.com.
This article by Simply Wall St is general in nature. We provide commentary based on historical data and analyst forecasts only using an unbiased methodology and our articles are not intended to be financial advice. It does not constitute a recommendation to buy or sell any stock, and does not take account of your objectives, or your financial situation. We aim to bring you long-term focused analysis driven by fundamental data. Note that our analysis may not factor in the latest price-sensitive company announcements or qualitative material. Simply Wall St has no position in any stocks mentioned.
