
 Yahoo Finance
 Trevali Mining (TSE:TV shareholders incur further losses as stock declines 26% this week, taking five-year losses to 89%
Long term investing is the way to go, but that doesn't mean you should hold every stock forever. It hits us in the gut when we see fellow investors suffer a loss. For example, we sympathize with anyone who was caught holding Trevali Mining Corporation (TSE:TV) during the five years that saw its share price drop a whopping 89%. And we doubt long term believers are the only worried holders, since the stock price has declined 22% over the last twelve months. The falls have accelerated recently, with the share price down 40% in the last three months. We really feel for shareholders in this scenario. It's a good reminder of the importance of diversification, and it's worth keeping in mind there's more to life than money, anyway.
Since Trevali Mining has shed US$49m from its value in the past 7 days, let's see if the longer term decline has been driven by the business' economics.
View our latest analysis for Trevali Mining
Trevali Mining wasn't profitable in the last twelve months, it is unlikely we'll see a strong correlation between its share price and its earnings per share (EPS). Arguably revenue is our next best option. Shareholders of unprofitable companies usually expect strong revenue growth. That's because fast revenue growth can be easily extrapolated to forecast profits, often of considerable size.
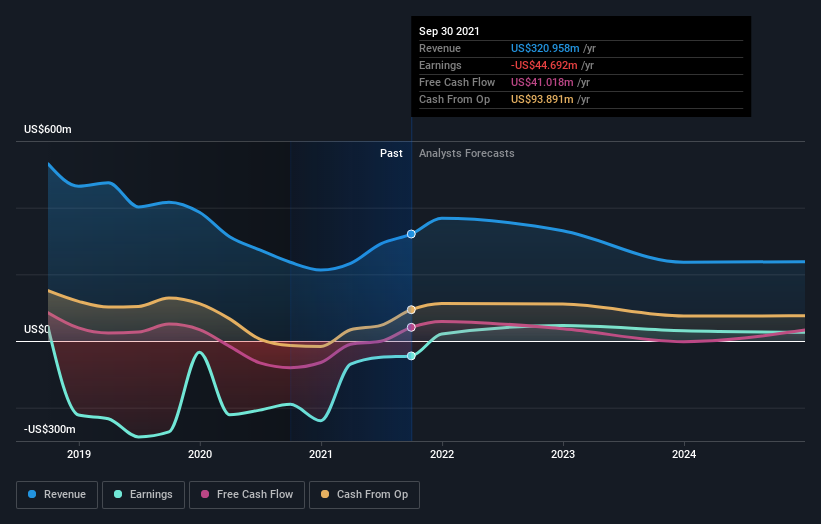
In the last half decade, Trevali Mining saw its revenue increase by 7.4% per year. That's a pretty good rate for a long time period. So it is unexpected to see the stock down 14% per year in the last five years. The truth is that the growth might be below expectations, and investors are probably worried about the continual losses.
You can see how earnings and revenue have changed over time in the image below (click on the chart to see the exact values).
Take a more thorough look at Trevali Mining's financial health with this free report on its balance sheet.
A Different Perspective
Investors in Trevali Mining had a tough year, with a total loss of 22%, against a market gain of about 22%. Even the share prices of good stocks drop sometimes, but we want to see improvements in the fundamental metrics of a business, before getting too interested. Unfortunately, longer term shareholders are suffering worse, given the loss of 14% doled out over the last five years. We'd need to see some sustained improvements in the key metrics before we could muster much enthusiasm. I find it very interesting to look at share price over the long term as a proxy for business performance. But to truly gain insight, we need to consider other information, too. Consider for instance, the ever-present spectre of investment risk. We've identified 1 warning sign with Trevali Mining , and understanding them should be part of your investment process.
But note: Trevali Mining may not be the best stock to buy. So take a peek at this free list of interesting companies with past earnings growth (and further growth forecast).
Please note, the market returns quoted in this article reflect the market weighted average returns of stocks that currently trade on CA exchanges.
Have feedback on this article? Concerned about the content? Get in touch with us directly. Alternatively, email editorial-team (at) simplywallst.com.
This article by Simply Wall St is general in nature. We provide commentary based on historical data and analyst forecasts only using an unbiased methodology and our articles are not intended to be financial advice. It does not constitute a recommendation to buy or sell any stock, and does not take account of your objectives, or your financial situation. We aim to bring you long-term focused analysis driven by fundamental data. Note that our analysis may not factor in the latest price-sensitive company announcements or qualitative material. Simply Wall St has no position in any stocks mentioned.
