
 Yahoo Finance
 The Trend Of High Returns At Polymetal International (LON:POLY) Has Us Very Interested
If you're not sure where to start when looking for the next multi-bagger, there are a few key trends you should keep an eye out for. One common approach is to try and find a company with returns on capital employed (ROCE) that are increasing, in conjunction with a growing amount of capital employed. Put simply, these types of businesses are compounding machines, meaning they are continually reinvesting their earnings at ever-higher rates of return. And in light of that, the trends we're seeing at Polymetal International's (LON:POLY) look very promising so lets take a look.
Return On Capital Employed (ROCE): What is it?
For those who don't know, ROCE is a measure of a company's yearly pre-tax profit (its return), relative to the capital employed in the business. To calculate this metric for Polymetal International, this is the formula:
Return on Capital Employed = Earnings Before Interest and Tax (EBIT) ÷ (Total Assets - Current Liabilities)
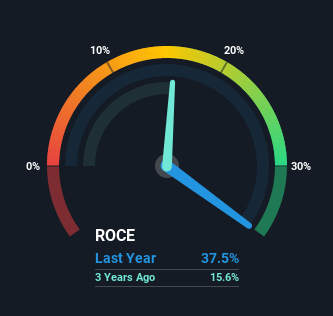
0.37 = US$1.5b ÷ (US$4.8b - US$740m) (Based on the trailing twelve months to June 2021).
So, Polymetal International has an ROCE of 37%. In absolute terms that's a great return and it's even better than the Metals and Mining industry average of 18%.
See our latest analysis for Polymetal International
In the above chart we have measured Polymetal International's prior ROCE against its prior performance, but the future is arguably more important. If you'd like to see what analysts are forecasting going forward, you should check out our free report for Polymetal International.
The Trend Of ROCE
We like the trends that we're seeing from Polymetal International. The numbers show that in the last five years, the returns generated on capital employed have grown considerably to 37%. Basically the business is earning more per dollar of capital invested and in addition to that, 105% more capital is being employed now too. So we're very much inspired by what we're seeing at Polymetal International thanks to its ability to profitably reinvest capital.
In Conclusion...
In summary, it's great to see that Polymetal International can compound returns by consistently reinvesting capital at increasing rates of return, because these are some of the key ingredients of those highly sought after multi-baggers. And with the stock having performed exceptionally well over the last five years, these patterns are being accounted for by investors. In light of that, we think it's worth looking further into this stock because if Polymetal International can keep these trends up, it could have a bright future ahead.
If you'd like to know about the risks facing Polymetal International, we've discovered 2 warning signs that you should be aware of.
Polymetal International is not the only stock earning high returns. If you'd like to see more, check out our free list of companies earning high returns on equity with solid fundamentals.
This article by Simply Wall St is general in nature. We provide commentary based on historical data and analyst forecasts only using an unbiased methodology and our articles are not intended to be financial advice. It does not constitute a recommendation to buy or sell any stock, and does not take account of your objectives, or your financial situation. We aim to bring you long-term focused analysis driven by fundamental data. Note that our analysis may not factor in the latest price-sensitive company announcements or qualitative material. Simply Wall St has no position in any stocks mentioned.
Have feedback on this article? Concerned about the content? Get in touch with us directly. Alternatively, email editorial-team (at) simplywallst.com.
