
 Yahoo Finance
 The Trend Of High Returns At Cadence Design Systems (NASDAQ:CDNS) Has Us Very Interested
Did you know there are some financial metrics that can provide clues of a potential multi-bagger? One common approach is to try and find a company with returns on capital employed (ROCE) that are increasing, in conjunction with a growing amount of capital employed. If you see this, it typically means it's a company with a great business model and plenty of profitable reinvestment opportunities. And in light of that, the trends we're seeing at Cadence Design Systems' (NASDAQ:CDNS) look very promising so lets take a look.
Return On Capital Employed (ROCE): What Is It?
If you haven't worked with ROCE before, it measures the 'return' (pre-tax profit) a company generates from capital employed in its business. The formula for this calculation on Cadence Design Systems is:
Return on Capital Employed = Earnings Before Interest and Tax (EBIT) ÷ (Total Assets - Current Liabilities)
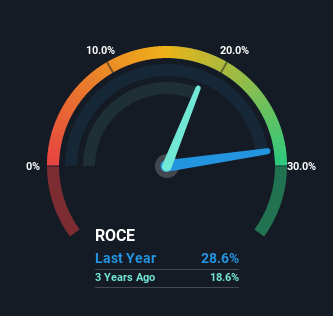
0.29 = US$1.1b ÷ (US$5.1b - US$1.3b) (Based on the trailing twelve months to December 2022).
Therefore, Cadence Design Systems has an ROCE of 29%. That's a fantastic return and not only that, it outpaces the average of 9.5% earned by companies in a similar industry.
View our latest analysis for Cadence Design Systems
In the above chart we have measured Cadence Design Systems' prior ROCE against its prior performance, but the future is arguably more important. If you'd like, you can check out the forecasts from the analysts covering Cadence Design Systems here for free.
What Does the ROCE Trend For Cadence Design Systems Tell Us?
Cadence Design Systems is displaying some positive trends. The numbers show that in the last five years, the returns generated on capital employed have grown considerably to 29%. Basically the business is earning more per dollar of capital invested and in addition to that, 114% more capital is being employed now too. The increasing returns on a growing amount of capital is common amongst multi-baggers and that's why we're impressed.
The Bottom Line On Cadence Design Systems' ROCE
A company that is growing its returns on capital and can consistently reinvest in itself is a highly sought after trait, and that's what Cadence Design Systems has. And with the stock having performed exceptionally well over the last five years, these patterns are being accounted for by investors. So given the stock has proven it has promising trends, it's worth researching the company further to see if these trends are likely to persist.
One more thing to note, we've identified 1 warning sign with Cadence Design Systems and understanding this should be part of your investment process.
High returns are a key ingredient to strong performance, so check out our free list ofstocks earning high returns on equity with solid balance sheets.
Have feedback on this article? Concerned about the content? Get in touch with us directly. Alternatively, email editorial-team (at) simplywallst.com.
This article by Simply Wall St is general in nature. We provide commentary based on historical data and analyst forecasts only using an unbiased methodology and our articles are not intended to be financial advice. It does not constitute a recommendation to buy or sell any stock, and does not take account of your objectives, or your financial situation. We aim to bring you long-term focused analysis driven by fundamental data. Note that our analysis may not factor in the latest price-sensitive company announcements or qualitative material. Simply Wall St has no position in any stocks mentioned.
Join A Paid User Research Session
You’ll receive a US$30 Amazon Gift card for 1 hour of your time while helping us build better investing tools for the individual investors like yourself. Sign up here
