
 Yahoo Finance
 Trading Risk Trends in Japanese Yen Pairs with Stock Market Levels
Short Term stock market levels to time risk trends
GBPJPY bigger top in the making?
Monitor USDMXN for support at slightly lower levels
Subscribe to Jamie Saettele's distribution list in order to receive FX trading strategy delivered to your inbox.
Jamie is the author of Sentiment in the Forex Market.
Dow Jones Industrial Average
Daily
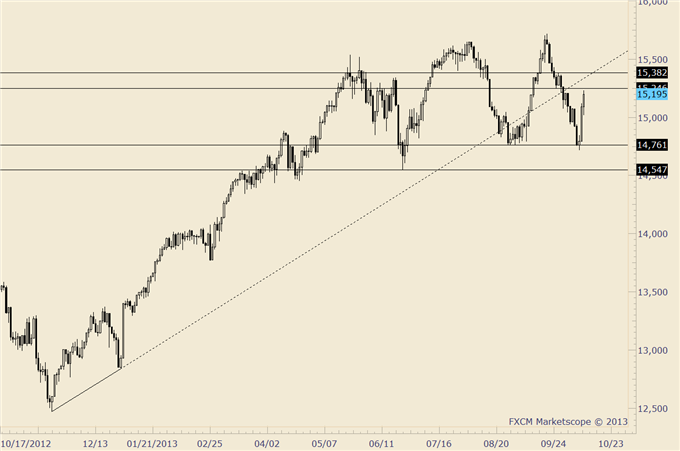
Chart Prepared by Jamie Saettele, CMT
Automate trades with Mirror Trader
-After a dip under the August low (the index was actually overlapping with mid-April levels). The DJIA rallied 2.93% in 2 days. This is the largest 2 day rally since 12/31/12-1/2/13.
-Sideways action since May is either a topping formation or consolidation before a fantastic ‘blowoff’ that ultimately ends in tears.
-While in the range however, be aware of the following levels: 15250 and 15382 as near term resistance as well as the line that originates at the November low and 14945 and 14795 as supports.
Trading Strategy: Know these levels in order to time risk trends.
GBP/JPY
Daily

Chart Prepared by Jamie Saettele, CMT using Marketscope 2.0
Automate trades with Mirror Trader
-The line that originates at the November 2012 low came into play as resistance at the 10/1 high.
-The decline from the 10/1 high is impulsive (5 waves). While the drop may could constitute a flat, it would be silly not to consider the alternative given the reaction at the underside of the mentioned trendline and early month high.
-GBPJPY broke below support (red rectangle on chart) on 10/3. Price has advanced in recent days to challenge the level as resistance. So far, that level is holding.
Trading Strategy: Looking for a high on Monday. Resistance extends to 158.70 (10/1 close).
Daily

Chart Prepared by Jamie Saettele, CMT using Marketscope 2.0
Automate trades with Mirror Trader
-The line that originates from the June 2012 low defines the long term trend but the trend since April is sideways.
-NZDJPY ends the week at a Fibonacci confluence; the 61.8% retracement of the decline from the April high and 61.8% retracement of the decline from Sep 19th-Oct 2nd. Friday’s high is also right at the 9/26 high.
Trading Strategy: Exited longs Friday. This market ends the week at resistance but the near term picture is too uncertain to take a near term view. Support is 81.15/50 and resistance is 82.60-83.05. If the market reaches these levels, then I may take action.
Daily

Chart Prepared by Jamie Saettele, CMT using Marketscope 2.0
Automate trades with Mirror Trader
-“USDMXN has been trading in a broad range since the June high. The pattern may take the form of a 3 point ascending triangle. Such patterns have the ability to produce intense bullish market moves.”
-“Thursday’s spike (10/3) probably caps the advance for a bit. Levels to watch for support are the 50% and 61.8% retracements of the rally from the September low at 12.96 and 12.87.”
Trading Strategy: Monitoring this market for support at lower levels. The break of the recent range portends a move towards 12.85. Stay tuned.
--- Written by Jamie Saettele, CMT, Senior Technical Strategist for DailyFX.com
To contact Jamie e-mail jsaettele@dailyfx.com. Follow him on Twitter @JamieSaettele
DailyFX provides forex news and technical analysis on the trends that influence the global currency markets.
Learn forex trading with a free practice account and trading charts from FXCM.
