
 Yahoo Finance
 The Trade Desk, Inc.'s (NASDAQ:TTD) Stock Is Rallying But Financials Look Ambiguous: Will The Momentum Continue?
Trade Desk (NASDAQ:TTD) has had a great run on the share market with its stock up by a significant 21% over the last three months. However, we decided to pay attention to the company's fundamentals which don't appear to give a clear sign about the company's financial health. Particularly, we will be paying attention to Trade Desk's ROE today.
ROE or return on equity is a useful tool to assess how effectively a company can generate returns on the investment it received from its shareholders. In short, ROE shows the profit each dollar generates with respect to its shareholder investments.
Check out our latest analysis for Trade Desk
How To Calculate Return On Equity?
The formula for return on equity is:
Return on Equity = Net Profit (from continuing operations) ÷ Shareholders' Equity
So, based on the above formula, the ROE for Trade Desk is:
4.0% = US$77m ÷ US$1.9b (Based on the trailing twelve months to March 2023).
The 'return' refers to a company's earnings over the last year. That means that for every $1 worth of shareholders' equity, the company generated $0.04 in profit.
Why Is ROE Important For Earnings Growth?
We have already established that ROE serves as an efficient profit-generating gauge for a company's future earnings. Based on how much of its profits the company chooses to reinvest or "retain", we are then able to evaluate a company's future ability to generate profits. Assuming everything else remains unchanged, the higher the ROE and profit retention, the higher the growth rate of a company compared to companies that don't necessarily bear these characteristics.
Trade Desk's Earnings Growth And 4.0% ROE
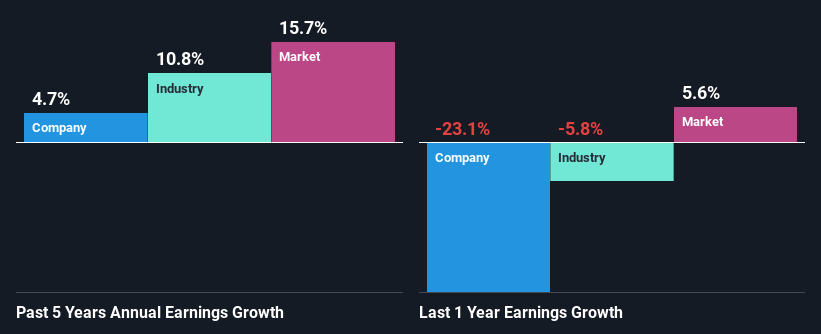
As you can see, Trade Desk's ROE looks pretty weak. Even when compared to the industry average of 12%, the ROE figure is pretty disappointing. Therefore, the disappointing ROE therefore provides a background to Trade Desk's very little net income growth of 4.7% over the past five years.
As a next step, we compared Trade Desk's net income growth with the industry and were disappointed to see that the company's growth is lower than the industry average growth of 11% in the same period.
Earnings growth is a huge factor in stock valuation. The investor should try to establish if the expected growth or decline in earnings, whichever the case may be, is priced in. This then helps them determine if the stock is placed for a bright or bleak future. If you're wondering about Trade Desk's's valuation, check out this gauge of its price-to-earnings ratio, as compared to its industry.
Is Trade Desk Efficiently Re-investing Its Profits?
Trade Desk doesn't pay any dividend, meaning that potentially all of its profits are being reinvested in the business. However, there's only been very little earnings growth to show for it. Therefore, there might be some other reasons to explain the lack in that respect. For example, the business could be in decline.
Summary
In total, we're a bit ambivalent about Trade Desk's performance. While the company does have a high rate of reinvestment, the low ROE means that all that reinvestment is not reaping any benefit to its investors, and moreover, its having a negative impact on the earnings growth. That being so, the latest analyst forecasts show that the company will continue to see an expansion in its earnings. To know more about the latest analysts predictions for the company, check out this visualization of analyst forecasts for the company.
Have feedback on this article? Concerned about the content? Get in touch with us directly. Alternatively, email editorial-team (at) simplywallst.com.
This article by Simply Wall St is general in nature. We provide commentary based on historical data and analyst forecasts only using an unbiased methodology and our articles are not intended to be financial advice. It does not constitute a recommendation to buy or sell any stock, and does not take account of your objectives, or your financial situation. We aim to bring you long-term focused analysis driven by fundamental data. Note that our analysis may not factor in the latest price-sensitive company announcements or qualitative material. Simply Wall St has no position in any stocks mentioned.
Join A Paid User Research Session
You’ll receive a US$30 Amazon Gift card for 1 hour of your time while helping us build better investing tools for the individual investors like yourself. Sign up here
