
 Yahoo Finance
 The total return for Fabrinet (NYSE:FN) investors has risen faster than earnings growth over the last five years
Fabrinet (NYSE:FN) shareholders might be concerned after seeing the share price drop 12% in the last month. But that scarcely detracts from the really solid long term returns generated by the company over five years. We think most investors would be happy with the 194% return, over that period. Generally speaking the long term returns will give you a better idea of business quality than short periods can. Of course, that doesn't necessarily mean it's cheap now.
In light of the stock dropping 7.0% in the past week, we want to investigate the longer term story, and see if fundamentals have been the driver of the company's positive five-year return.
See our latest analysis for Fabrinet
While markets are a powerful pricing mechanism, share prices reflect investor sentiment, not just underlying business performance. One imperfect but simple way to consider how the market perception of a company has shifted is to compare the change in the earnings per share (EPS) with the share price movement.
Over half a decade, Fabrinet managed to grow its earnings per share at 20% a year. So the EPS growth rate is rather close to the annualized share price gain of 24% per year. This indicates that investor sentiment towards the company has not changed a great deal. In fact, the share price seems to largely reflect the EPS growth.
You can see how EPS has changed over time in the image below (click on the chart to see the exact values).
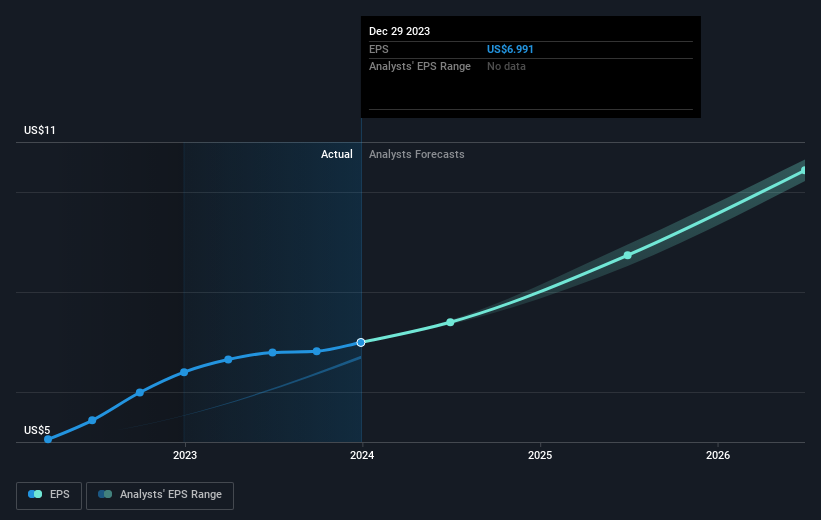
This free interactive report on Fabrinet's earnings, revenue and cash flow is a great place to start, if you want to investigate the stock further.
A Different Perspective
It's good to see that Fabrinet has rewarded shareholders with a total shareholder return of 75% in the last twelve months. That's better than the annualised return of 24% over half a decade, implying that the company is doing better recently. Someone with an optimistic perspective could view the recent improvement in TSR as indicating that the business itself is getting better with time. It's always interesting to track share price performance over the longer term. But to understand Fabrinet better, we need to consider many other factors. Take risks, for example - Fabrinet has 1 warning sign we think you should be aware of.
If you are like me, then you will not want to miss this free list of growing companies that insiders are buying.
Please note, the market returns quoted in this article reflect the market weighted average returns of stocks that currently trade on American exchanges.
Have feedback on this article? Concerned about the content? Get in touch with us directly. Alternatively, email editorial-team (at) simplywallst.com.
This article by Simply Wall St is general in nature. We provide commentary based on historical data and analyst forecasts only using an unbiased methodology and our articles are not intended to be financial advice. It does not constitute a recommendation to buy or sell any stock, and does not take account of your objectives, or your financial situation. We aim to bring you long-term focused analysis driven by fundamental data. Note that our analysis may not factor in the latest price-sensitive company announcements or qualitative material. Simply Wall St has no position in any stocks mentioned.
