
 Yahoo Finance
 Those Who Purchased Tower (NZSE:TWR) Shares Five Years Ago Have A 70% Loss To Show For It
We think intelligent long term investing is the way to go. But no-one is immune from buying too high. For example the Tower Limited (NZSE:TWR) share price dropped 70% over five years. That's an unpleasant experience for long term holders. Furthermore, it's down 17% in about a quarter. That's not much fun for holders. However, one could argue that the price has been influenced by the general market, which is down 12% in the same timeframe.
See our latest analysis for Tower
To paraphrase Benjamin Graham: Over the short term the market is a voting machine, but over the long term it's a weighing machine. One way to examine how market sentiment has changed over time is to look at the interaction between a company's share price and its earnings per share (EPS).
During five years of share price growth, Tower moved from a loss to profitability. That would generally be considered a positive, so we are surprised to see the share price is down. Other metrics may better explain the share price move.
In contrast to the share price, revenue has actually increased by 2.7% a year in the five year period. So it seems one might have to take closer look at the fundamentals to understand why the share price languishes. After all, there may be an opportunity.
You can see below how earnings and revenue have changed over time (discover the exact values by clicking on the image).
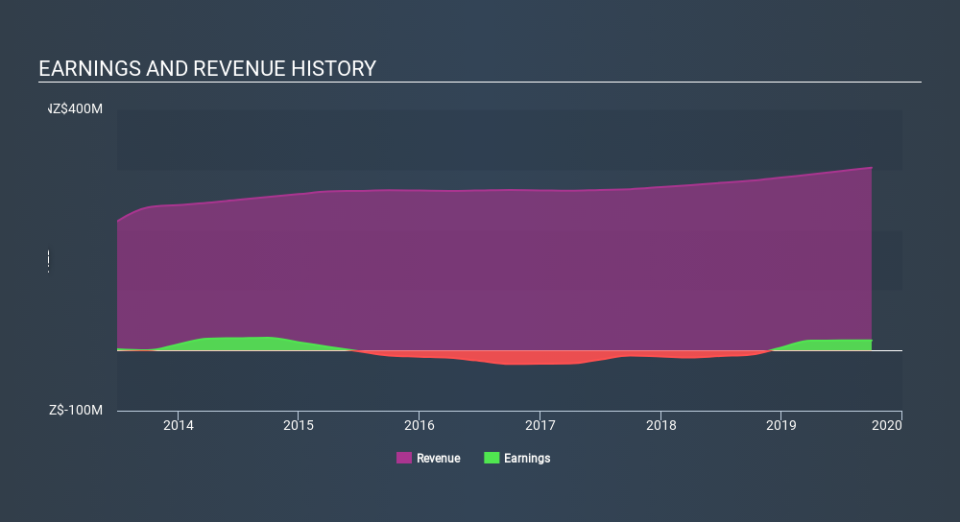
It is of course excellent to see how Tower has grown profits over the years, but the future is more important for shareholders. This free interactive report on Tower's balance sheet strength is a great place to start, if you want to investigate the stock further.
What about the Total Shareholder Return (TSR)?
We'd be remiss not to mention the difference between Tower's total shareholder return (TSR) and its share price return. The TSR attempts to capture the value of dividends (as if they were reinvested) as well as any spin-offs or discounted capital raisings offered to shareholders. Its history of dividend payouts mean that Tower's TSR, which was a 56% drop over the last 5 years, was not as bad as the share price return.
A Different Perspective
While the broader market gained around 2.9% in the last year, Tower shareholders lost 17%. However, keep in mind that even the best stocks will sometimes underperform the market over a twelve month period. Regrettably, last year's performance caps off a bad run, with the shareholders facing a total loss of 15% per year over five years. We realise that Baron Rothschild has said investors should "buy when there is blood on the streets", but we caution that investors should first be sure they are buying a high quality business. I find it very interesting to look at share price over the long term as a proxy for business performance. But to truly gain insight, we need to consider other information, too. Consider risks, for instance. Every company has them, and we've spotted 1 warning sign for Tower you should know about.
Of course, you might find a fantastic investment by looking elsewhere. So take a peek at this free list of companies we expect will grow earnings.
Please note, the market returns quoted in this article reflect the market weighted average returns of stocks that currently trade on NZ exchanges.
If you spot an error that warrants correction, please contact the editor at editorial-team@simplywallst.com. This article by Simply Wall St is general in nature. It does not constitute a recommendation to buy or sell any stock, and does not take account of your objectives, or your financial situation. Simply Wall St has no position in the stocks mentioned.
We aim to bring you long-term focused research analysis driven by fundamental data. Note that our analysis may not factor in the latest price-sensitive company announcements or qualitative material. Thank you for reading.
