
 Yahoo Finance
 Those Who Purchased PayGroup (ASX:PYG) Shares A Year Ago Have A 24% Loss To Show For It

The simplest way to benefit from a rising market is to buy an index fund. While individual stocks can be big winners, plenty more fail to generate satisfactory returns. Unfortunately the PayGroup Limited (ASX:PYG) share price slid 24% over twelve months. That's well bellow the market return of -10%. Because PayGroup hasn't been listed for many years, the market is still learning about how the business performs. On the other hand the share price has bounced 6.0% over the last week. The buoyant market could have helped drive the share price pop, since stocks are up 4.9% in the same period.
See our latest analysis for PayGroup
PayGroup wasn't profitable in the last twelve months, it is unlikely we'll see a strong correlation between its share price and its earnings per share (EPS). Arguably revenue is our next best option. Generally speaking, companies without profits are expected to grow revenue every year, and at a good clip. That's because fast revenue growth can be easily extrapolated to forecast profits, often of considerable size.
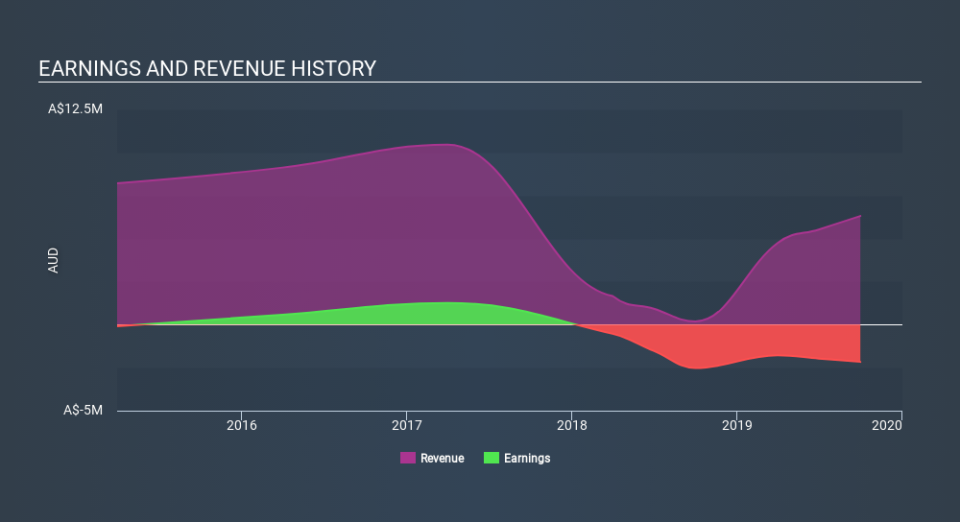
PayGroup grew its revenue by 3334% over the last year. That's a strong result which is better than most other loss making companies. The share price drop of 24% over twelve months would be considered disappointing by many, so you might argue the company is getting little credit for its impressive revenue growth. Prima facie, revenue growth like that should be a good thing, so it's worth checking whether losses have stabilized. Our brains have evolved to think in linear fashion, so there's value in learning to recognize exponential growth. We are, in some ways, simply the wisest of the monkeys.
The image below shows how earnings and revenue have tracked over time (if you click on the image you can see greater detail).
Take a more thorough look at PayGroup's financial health with this free report on its balance sheet.
A Different Perspective
PayGroup shareholders are down 24% for the year, even worse than the market loss of 10%. That's disappointing, but it's worth keeping in mind that the market-wide selling wouldn't have helped. With the stock down 21% over the last three months, the market doesn't seem to believe that the company has solved all its problems. Given the relatively short history of this stock, we'd remain pretty wary until we see some strong business performance. While it is well worth considering the different impacts that market conditions can have on the share price, there are other factors that are even more important. To that end, you should learn about the 6 warning signs we've spotted with PayGroup (including 1 which is makes us a bit uncomfortable) .
If you like to buy stocks alongside management, then you might just love this free list of companies. (Hint: insiders have been buying them).
Please note, the market returns quoted in this article reflect the market weighted average returns of stocks that currently trade on AU exchanges.
If you spot an error that warrants correction, please contact the editor at editorial-team@simplywallst.com. This article by Simply Wall St is general in nature. It does not constitute a recommendation to buy or sell any stock, and does not take account of your objectives, or your financial situation. Simply Wall St has no position in the stocks mentioned.
We aim to bring you long-term focused research analysis driven by fundamental data. Note that our analysis may not factor in the latest price-sensitive company announcements or qualitative material. Thank you for reading.
