
 Yahoo Finance
 Those Who Purchased Michael Hill International (ASX:MHJ) Shares Three Years Ago Have A 48% Loss To Show For It

For many investors, the main point of stock picking is to generate higher returns than the overall market. But if you try your hand at stock picking, your risk returning less than the market. Unfortunately, that's been the case for longer term Michael Hill International Limited (ASX:MHJ) shareholders, since the share price is down 48% in the last three years, falling well short of the market return of around 37%. There was little comfort for shareholders in the last week as the price declined a further 5.8%.
Check out our latest analysis for Michael Hill International
While the efficient markets hypothesis continues to be taught by some, it has been proven that markets are over-reactive dynamic systems, and investors are not always rational. One way to examine how market sentiment has changed over time is to look at the interaction between a company's share price and its earnings per share (EPS).
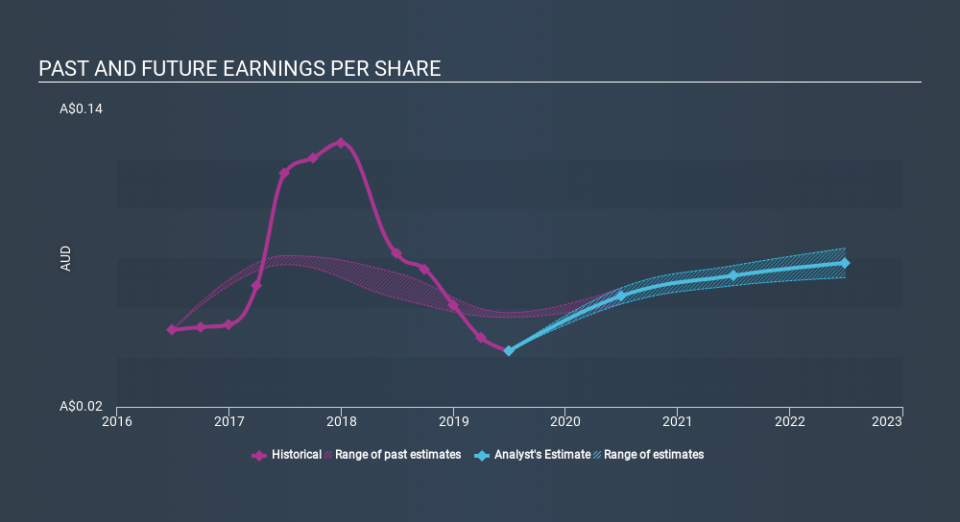
During the three years that the share price fell, Michael Hill International's earnings per share (EPS) dropped by 5.9% each year. This reduction in EPS is slower than the 20% annual reduction in the share price. So it's likely that the EPS decline has disappointed the market, leaving investors hesitant to buy.
The graphic below depicts how EPS has changed over time (unveil the exact values by clicking on the image).
We consider it positive that insiders have made significant purchases in the last year. Having said that, most people consider earnings and revenue growth trends to be a more meaningful guide to the business. Dive deeper into the earnings by checking this interactive graph of Michael Hill International's earnings, revenue and cash flow.
What About Dividends?
It is important to consider the total shareholder return, as well as the share price return, for any given stock. The TSR incorporates the value of any spin-offs or discounted capital raisings, along with any dividends, based on the assumption that the dividends are reinvested. Arguably, the TSR gives a more comprehensive picture of the return generated by a stock. As it happens, Michael Hill International's TSR for the last 3 years was -40%, which exceeds the share price return mentioned earlier. And there's no prize for guessing that the dividend payments largely explain the divergence!
A Different Perspective
While the market return was 20% in the last year, Michael Hill International returned 22% to shareholders. Shareholders can take comfort that it's certainly better than the yearly loss of about 16% per year endured over the last three years. The optimist would say that this might be the dawn of a brighter future. I find it very interesting to look at share price over the long term as a proxy for business performance. But to truly gain insight, we need to consider other information, too. For example, we've discovered 2 warning signs for Michael Hill International that you should be aware of before investing here.
Michael Hill International is not the only stock insiders are buying. So take a peek at this free list of growing companies with insider buying.
Please note, the market returns quoted in this article reflect the market weighted average returns of stocks that currently trade on AU exchanges.
If you spot an error that warrants correction, please contact the editor at editorial-team@simplywallst.com. This article by Simply Wall St is general in nature. It does not constitute a recommendation to buy or sell any stock, and does not take account of your objectives, or your financial situation. Simply Wall St has no position in the stocks mentioned.
We aim to bring you long-term focused research analysis driven by fundamental data. Note that our analysis may not factor in the latest price-sensitive company announcements or qualitative material. Thank you for reading.
