
 Yahoo Finance
 Those Who Purchased British American Tobacco (LON:BATS) Shares Three Years Ago Have A 52% Loss To Show For It

As an investor its worth striving to ensure your overall portfolio beats the market average. But its virtually certain that sometimes you will buy stocks that fall short of the market average returns. We regret to report that long term British American Tobacco p.l.c. (LON:BATS) shareholders have had that experience, with the share price dropping 52% in three years, versus a market return of about -18%. More recently, the share price has dropped a further 24% in a month. But this could be related to poor market conditions -- stocks are down 32% in the same time.
See our latest analysis for British American Tobacco
There is no denying that markets are sometimes efficient, but prices do not always reflect underlying business performance. One flawed but reasonable way to assess how sentiment around a company has changed is to compare the earnings per share (EPS) with the share price.
During the three years that the share price fell, British American Tobacco's earnings per share (EPS) dropped by 0.06% each year. This reduction in EPS is slower than the 22% annual reduction in the share price. So it's likely that the EPS decline has disappointed the market, leaving investors hesitant to buy. The less favorable sentiment is reflected in its current P/E ratio of 10.17.
You can see below how EPS has changed over time (discover the exact values by clicking on the image).
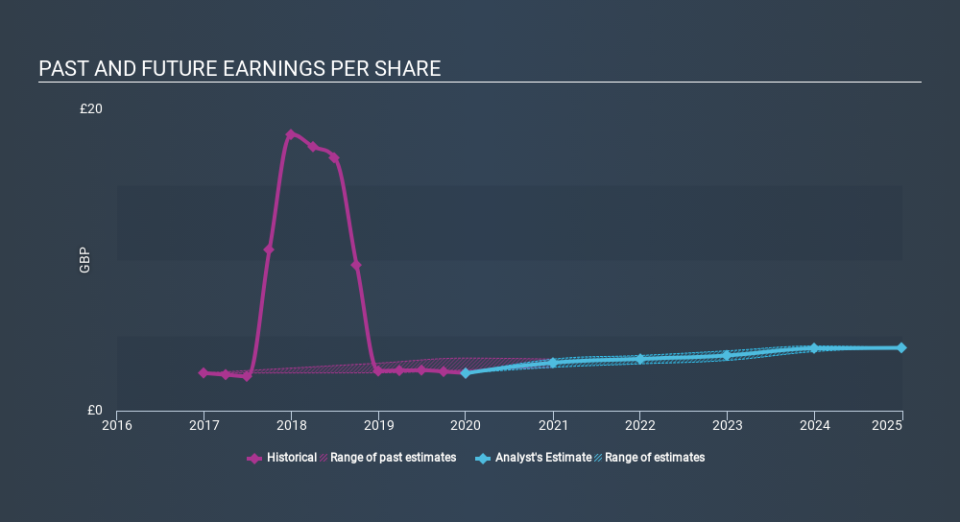
Dive deeper into British American Tobacco's key metrics by checking this interactive graph of British American Tobacco's earnings, revenue and cash flow.
What About Dividends?
It is important to consider the total shareholder return, as well as the share price return, for any given stock. The TSR incorporates the value of any spin-offs or discounted capital raisings, along with any dividends, based on the assumption that the dividends are reinvested. It's fair to say that the TSR gives a more complete picture for stocks that pay a dividend. In the case of British American Tobacco, it has a TSR of -44% for the last 3 years. That exceeds its share price return that we previously mentioned. This is largely a result of its dividend payments!
A Different Perspective
Although it hurts that British American Tobacco returned a loss of 13% in the last twelve months, the broader market was actually worse, returning a loss of 23%. Given the total loss of 2.3% per year over five years, it seems returns have deteriorated in the last twelve months. While some investors do well specializing in buying companies that are struggling (but nonetheless undervalued), don't forget that Buffett said that 'turnarounds seldom turn'. I find it very interesting to look at share price over the long term as a proxy for business performance. But to truly gain insight, we need to consider other information, too. To that end, you should learn about the 3 warning signs we've spotted with British American Tobacco (including 1 which is makes us a bit uncomfortable) .
Of course, you might find a fantastic investment by looking elsewhere. So take a peek at this free list of companies we expect will grow earnings.
Please note, the market returns quoted in this article reflect the market weighted average returns of stocks that currently trade on GB exchanges.
If you spot an error that warrants correction, please contact the editor at editorial-team@simplywallst.com. This article by Simply Wall St is general in nature. It does not constitute a recommendation to buy or sell any stock, and does not take account of your objectives, or your financial situation. Simply Wall St has no position in the stocks mentioned.
We aim to bring you long-term focused research analysis driven by fundamental data. Note that our analysis may not factor in the latest price-sensitive company announcements or qualitative material. Thank you for reading.
