
 Yahoo Finance
 Those who invested in Sandfire Resources (ASX:SFR) three years ago are up 62%
By buying an index fund, investors can approximate the average market return. But if you pick the right individual stocks, you could make more than that. For example, Sandfire Resources Limited (ASX:SFR) shareholders have seen the share price rise 41% over three years, well in excess of the market return (5.2%, not including dividends). On the other hand, the returns haven't been quite so good recently, with shareholders up just 21%.
Now it's worth having a look at the company's fundamentals too, because that will help us determine if the long term shareholder return has matched the performance of the underlying business.
View our latest analysis for Sandfire Resources
In his essay The Superinvestors of Graham-and-Doddsville Warren Buffett described how share prices do not always rationally reflect the value of a business. By comparing earnings per share (EPS) and share price changes over time, we can get a feel for how investor attitudes to a company have morphed over time.
Over the last three years, Sandfire Resources failed to grow earnings per share, which fell 42% (annualized).
Thus, it seems unlikely that the market is focussed on EPS growth at the moment. Since the change in EPS doesn't seem to correlate with the change in share price, it's worth taking a look at other metrics.
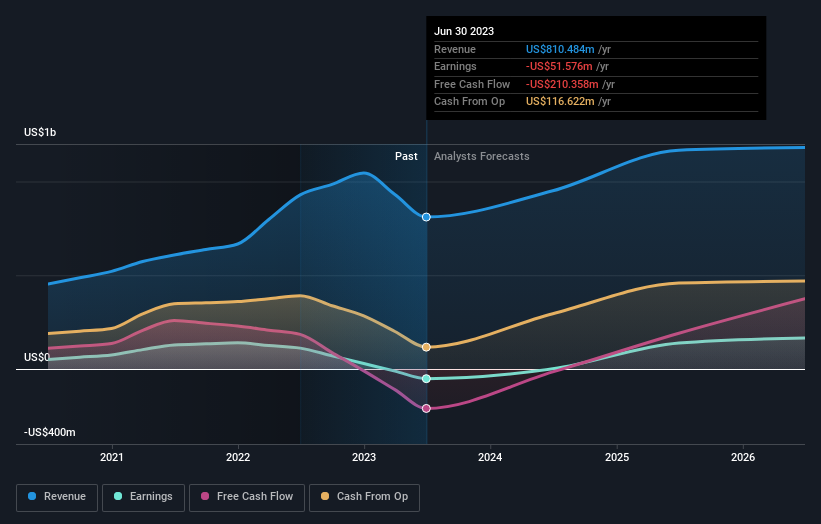
It could be that the revenue growth of 26% per year is viewed as evidence that Sandfire Resources is growing. If the company is being managed for the long term good, today's shareholders might be right to hold on.
You can see how earnings and revenue have changed over time in the image below (click on the chart to see the exact values).
Sandfire Resources is well known by investors, and plenty of clever analysts have tried to predict the future profit levels. So we recommend checking out this free report showing consensus forecasts
What About The Total Shareholder Return (TSR)?
We've already covered Sandfire Resources' share price action, but we should also mention its total shareholder return (TSR). The TSR is a return calculation that accounts for the value of cash dividends (assuming that any dividend received was reinvested) and the calculated value of any discounted capital raisings and spin-offs. Its history of dividend payouts mean that Sandfire Resources' TSR of 62% over the last 3 years is better than the share price return.
A Different Perspective
It's good to see that Sandfire Resources has rewarded shareholders with a total shareholder return of 21% in the last twelve months. That's better than the annualised return of 4% over half a decade, implying that the company is doing better recently. Someone with an optimistic perspective could view the recent improvement in TSR as indicating that the business itself is getting better with time. It's always interesting to track share price performance over the longer term. But to understand Sandfire Resources better, we need to consider many other factors. Take risks, for example - Sandfire Resources has 1 warning sign we think you should be aware of.
But note: Sandfire Resources may not be the best stock to buy. So take a peek at this free list of interesting companies with past earnings growth (and further growth forecast).
Please note, the market returns quoted in this article reflect the market weighted average returns of stocks that currently trade on Australian exchanges.
Have feedback on this article? Concerned about the content? Get in touch with us directly. Alternatively, email editorial-team (at) simplywallst.com.
This article by Simply Wall St is general in nature. We provide commentary based on historical data and analyst forecasts only using an unbiased methodology and our articles are not intended to be financial advice. It does not constitute a recommendation to buy or sell any stock, and does not take account of your objectives, or your financial situation. We aim to bring you long-term focused analysis driven by fundamental data. Note that our analysis may not factor in the latest price-sensitive company announcements or qualitative material. Simply Wall St has no position in any stocks mentioned.
