
 Yahoo Finance
 Those who invested in People Infrastructure (ASX:PPE) three years ago are up 95%
It hasn't been the best quarter for People Infrastructure Ltd (ASX:PPE) shareholders, since the share price has fallen 16% in that time. But over three years, the returns would have left most investors smiling In fact, the company's share price bested the return of its market index in that time, posting a gain of 79%.
Now it's worth having a look at the company's fundamentals too, because that will help us determine if the long term shareholder return has matched the performance of the underlying business.
Check out our latest analysis for People Infrastructure
There is no denying that markets are sometimes efficient, but prices do not always reflect underlying business performance. By comparing earnings per share (EPS) and share price changes over time, we can get a feel for how investor attitudes to a company have morphed over time.
During three years of share price growth, People Infrastructure achieved compound earnings per share growth of 20% per year. We don't think it is entirely coincidental that the EPS growth is reasonably close to the 21% average annual increase in the share price. That suggests that the market sentiment around the company hasn't changed much over that time. Quite to the contrary, the share price has arguably reflected the EPS growth.
The company's earnings per share (over time) is depicted in the image below (click to see the exact numbers).
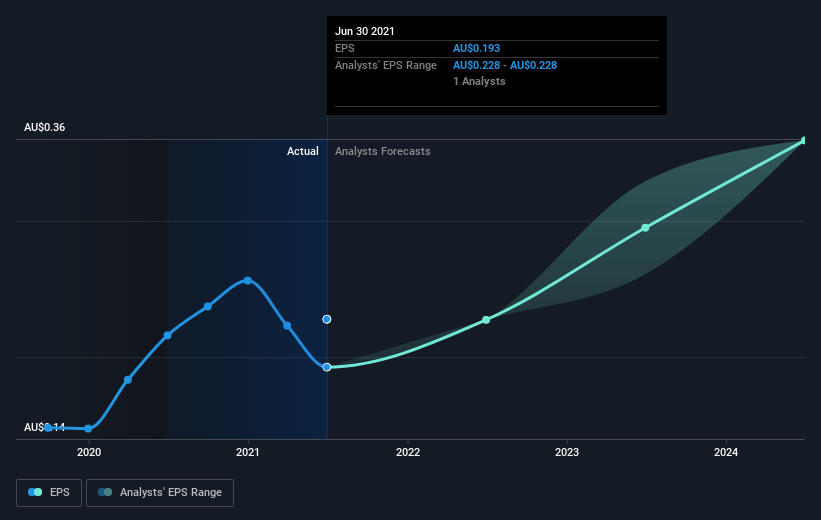
Dive deeper into People Infrastructure's key metrics by checking this interactive graph of People Infrastructure's earnings, revenue and cash flow.
What About Dividends?
As well as measuring the share price return, investors should also consider the total shareholder return (TSR). Whereas the share price return only reflects the change in the share price, the TSR includes the value of dividends (assuming they were reinvested) and the benefit of any discounted capital raising or spin-off. So for companies that pay a generous dividend, the TSR is often a lot higher than the share price return. As it happens, People Infrastructure's TSR for the last 3 years was 95%, which exceeds the share price return mentioned earlier. And there's no prize for guessing that the dividend payments largely explain the divergence!
A Different Perspective
People Infrastructure shareholders have gained 28% over twelve months (even including dividends). This isn't far from the market return of 30%. That's not at all bad, but the cherry on top is that it's an improvement on prior returns (since shareholders only made 25% yearly over the last three years). It's good to see the uptick, although the business fundamentals will need to move in the right direction if the company is to sustain the rise. While it is well worth considering the different impacts that market conditions can have on the share price, there are other factors that are even more important. Even so, be aware that People Infrastructure is showing 2 warning signs in our investment analysis , you should know about...
Of course People Infrastructure may not be the best stock to buy. So you may wish to see this free collection of growth stocks.
Please note, the market returns quoted in this article reflect the market weighted average returns of stocks that currently trade on AU exchanges.
This article by Simply Wall St is general in nature. We provide commentary based on historical data and analyst forecasts only using an unbiased methodology and our articles are not intended to be financial advice. It does not constitute a recommendation to buy or sell any stock, and does not take account of your objectives, or your financial situation. We aim to bring you long-term focused analysis driven by fundamental data. Note that our analysis may not factor in the latest price-sensitive company announcements or qualitative material. Simply Wall St has no position in any stocks mentioned.
Have feedback on this article? Concerned about the content? Get in touch with us directly. Alternatively, email editorial-team (at) simplywallst.com.
